2013-2014 Baseball Stats
Data Source: http://espn.go.com/mlb/stats/team/_/stat/batting/year/2014/seasontype/2/league/al
Summary of Data: Here you will find the baseball stats of the Major League Baseball in America composed of 30 teams.
This website was created by doing a case study of random data and coming up with 10 different scenarios with their results.
Summary of Data: Here you will find the baseball stats of the Major League Baseball in America composed of 30 teams.
This website was created by doing a case study of random data and coming up with 10 different scenarios with their results.
Exercises
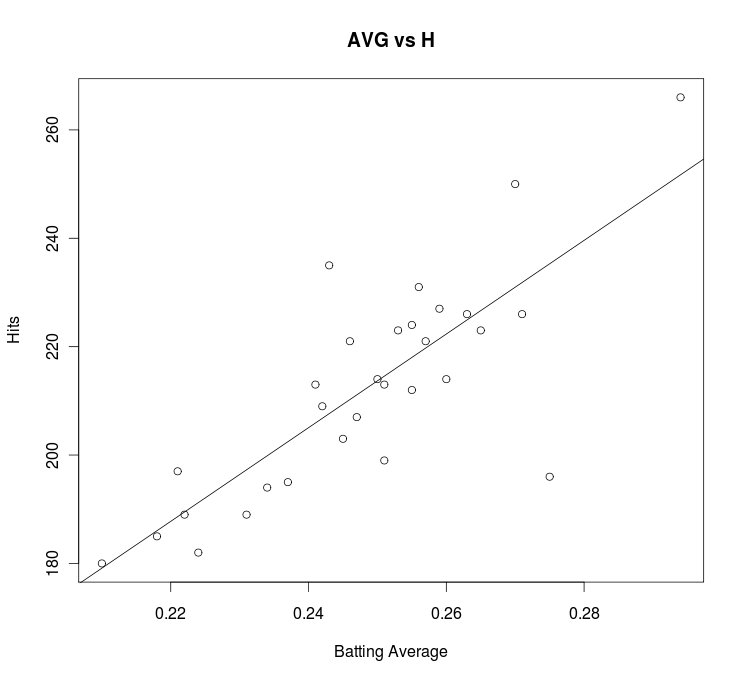
- Create a linear regression of AVG vs. H.
Answer: y-hat= -2.331x + 864.079
2. What is the correlation between R and H.
Answer: 0.726438
Answer: 0.726438
3. What is the correlation between OBP and AVG?
Answer: 0.78847769
Answer: 0.78847769
4. Create a box-plot of GP. What is the mean, 1st quartile and 3rd quartile?
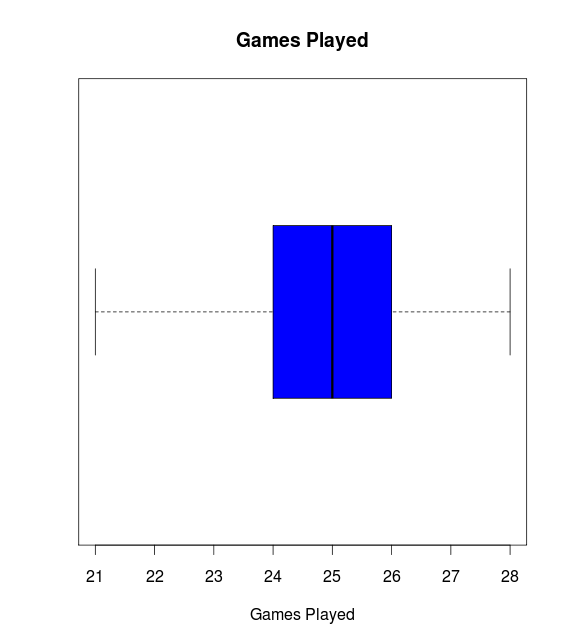
summary(GP): Min. 1st Qu.: 24.25, Mean: 25, 3rd Qu.: 26
5. Create a histogram of SLG. What can you say about the shape of the distribution?
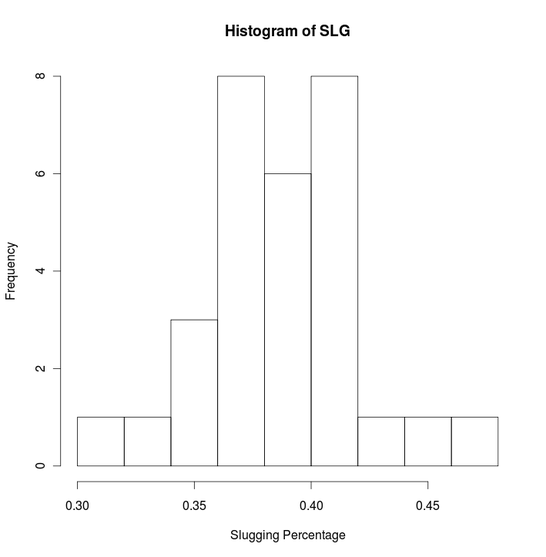
Distribution is Symmetrical
6. Create a histogram of the AVG. Does the data appear to be symmetrical, skewed right, or skewed left?
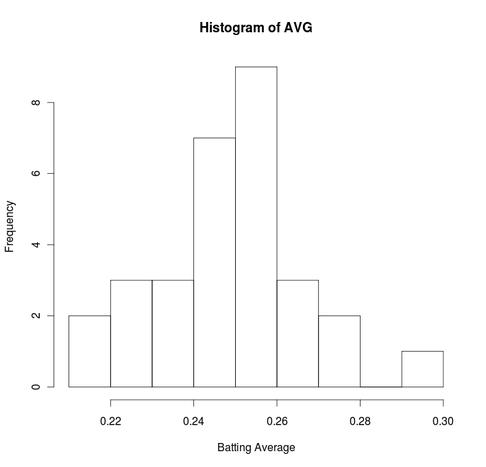
It appears to be skewed right.
7. What is the y-hat equation of plot OBP vs. SLG?
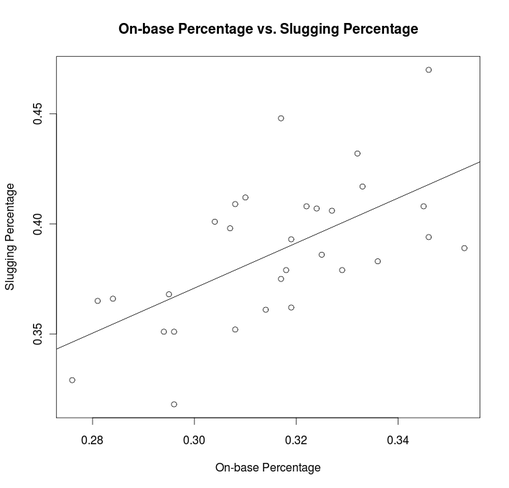
y- hat= 1.02328x + 0.06384
8. What is the correlation between the AVG and SLG?
Answer: 0.7635463
Answer: 0.7635463
9. Create a boxplot of SLG. Are there any outliers? if so, what are they?
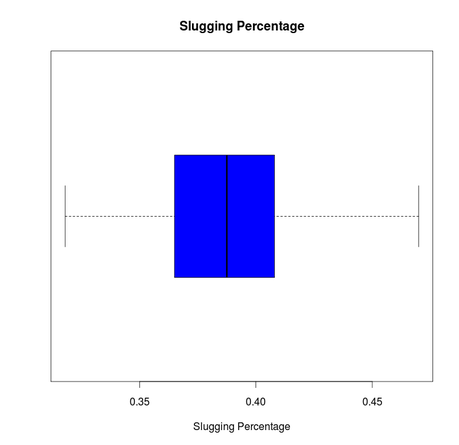
There are no outliers.
10. Create a plot of the following and give the linear regression equation for each:
a) R vs H
b) HR vs TB
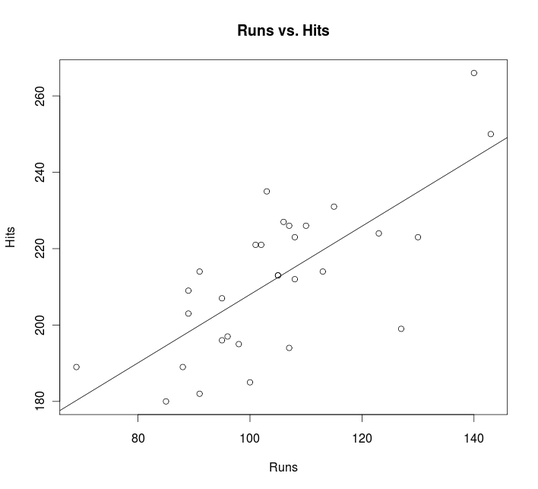
y-hat= 0.8949x +118.4985
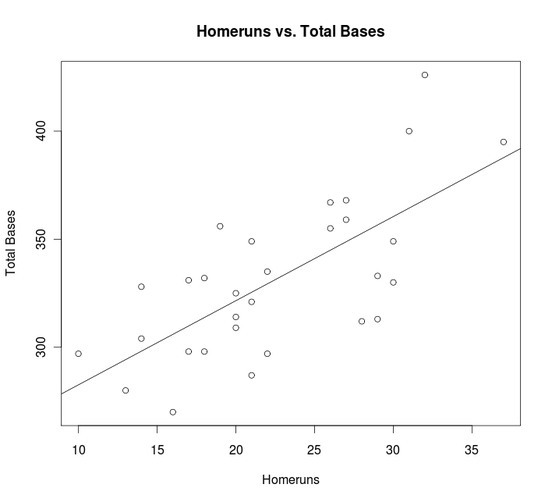
y-hat= 3.894x + 243.648
