Percentage of Different Types of Renewable Energy Sources in the United States
Research conducted by: Mark Jacobson (2011, see reference below)
Study and data prepared by: Peter Pham
Study and data prepared by: Peter Pham
Overview
This study was conducted by Professor Jacobson of Stanford University and his team, which created different state plans for all 50 states to transition to 100% renewable energy by the year 2050. Each plan identifies a custom mix of wind, water and solar (WWS) to power our energy for all purposes (electricity, transportation, heating/cooling and industry). The study provides data on the recommended or projected energy usage for a random state. The plans will stabilize/lower energy prices, create additional jobs, minimize air pollution, and combat global warming. They will also create enormous investment opportunities for clean energy, transportation and energy efficiency.
Questions to Answer
Do most of the states require the same amount of allocated renewable energy usage? Are there some types of renewable energy sources that most states won’t utilize?
Design Issues
This is an estimation of the different amounts of renewable energy sources that each state will have to use.
References
Jacobson, Mark. "The Solutions Project - 100% Renewable Energy." The Solutions Project. N.p., 13 June 2011. Web. 06 May 2014.
Exercises
1. Do certain energy sources see more use than others?
Yes, solar plants, and onshore wind in particular
2. Create a scatterplot of the CSP plant dataset.
plot(csp.plants)
3. Construct a histogram of the hydroelectric dataset.
hist(hydroelectric)
4. What is the mean percentage of the usage of CSP plants?
mean(csp.plants); 0.05825
5. What is the mean percentage of the usage of geothermal energy sources?
mean(geothermal); 0.05425
6. What are the standard deviation of the solar plant sources?
sd(solar.plants); 0.1566645
7. What is the first and third quartile of the solar plant sources?
quantile(solar.plants); 0.12975 and 0.21875
8. What are the standard deviation of the onshore wind sources?
sd(onshore.wind); 0.2101497
9. What is the first and third quartile of the solar plant sources?
quantile(onshore.wind); 0.100 and 0.425
10. What is the correlation between the state’s usage of onshore wind energy sources and the usage of offshore wind energy sources?
plot(onshore.wind,offshore.wind)
model=lm(offshore.wind~onshore.wind)
abline(model)
cor(offshore.wind, onshore.wind)
cor = -0.4279099
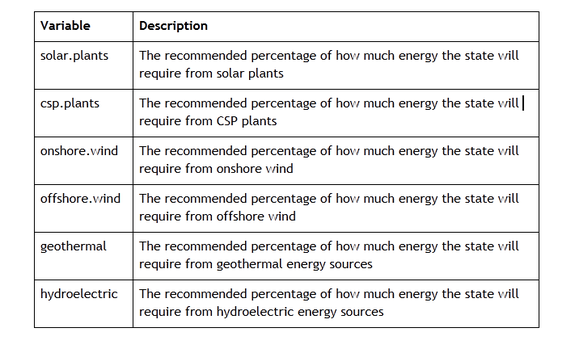
VARIABLES: "solar.plants" "csp.plants" "onshore.wind" "offshore.wind" "geothermal" "hydroelectric"
This study was conducted by Professor Jacobson of Stanford University and his team, which created different state plans for all 50 states to transition to 100% renewable energy by the year 2050. Each plan identifies a custom mix of wind, water and solar (WWS) to power our energy for all purposes (electricity, transportation, heating/cooling and industry). The study provides data on the recommended or projected energy usage for a random state. The plans will stabilize/lower energy prices, create additional jobs, minimize air pollution, and combat global warming. They will also create enormous investment opportunities for clean energy, transportation and energy efficiency.
Questions to Answer
Do most of the states require the same amount of allocated renewable energy usage? Are there some types of renewable energy sources that most states won’t utilize?
Design Issues
This is an estimation of the different amounts of renewable energy sources that each state will have to use.
References
Jacobson, Mark. "The Solutions Project - 100% Renewable Energy." The Solutions Project. N.p., 13 June 2011. Web. 06 May 2014.
Exercises
1. Do certain energy sources see more use than others?
Yes, solar plants, and onshore wind in particular
2. Create a scatterplot of the CSP plant dataset.
plot(csp.plants)
3. Construct a histogram of the hydroelectric dataset.
hist(hydroelectric)
4. What is the mean percentage of the usage of CSP plants?
mean(csp.plants); 0.05825
5. What is the mean percentage of the usage of geothermal energy sources?
mean(geothermal); 0.05425
6. What are the standard deviation of the solar plant sources?
sd(solar.plants); 0.1566645
7. What is the first and third quartile of the solar plant sources?
quantile(solar.plants); 0.12975 and 0.21875
8. What are the standard deviation of the onshore wind sources?
sd(onshore.wind); 0.2101497
9. What is the first and third quartile of the solar plant sources?
quantile(onshore.wind); 0.100 and 0.425
10. What is the correlation between the state’s usage of onshore wind energy sources and the usage of offshore wind energy sources?
plot(onshore.wind,offshore.wind)
model=lm(offshore.wind~onshore.wind)
abline(model)
cor(offshore.wind, onshore.wind)
cor = -0.4279099
VARIABLES: "solar.plants" "csp.plants" "onshore.wind" "offshore.wind" "geothermal" "hydroelectric"