BRUINS STATISTICS 2013-1014
Liv & Annalise
Data Chart:
https://docs.google.com/spreadsheets/d/1NhkMRykWRRdvitgkxOTOpWWNqt7l4h_EcDAMCQqaEy4/edit#gid=0
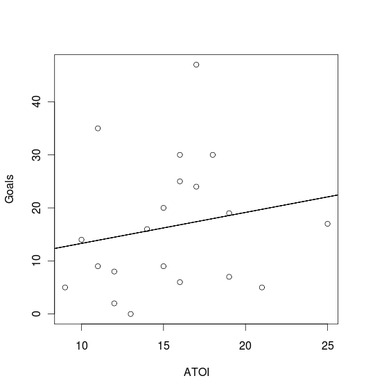
1. Create a scatterplot of average time on ice vs. number of goals
2. What is the equation for best line of fit of Goals v. ATOI
y=0.58x+7.46
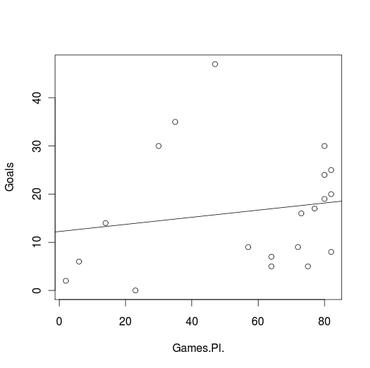
3. Create a scatterplot of games played vs. number of goals
4. What is the equation for best line of fit of Goals vs. Games Played
7=0.07x+12.24
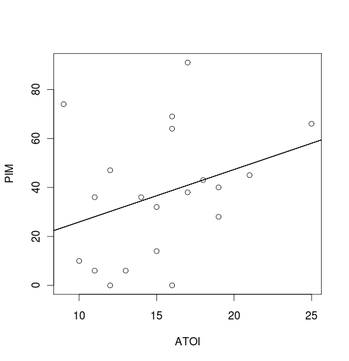
5. Create a scatterplot of the average time on ice ice vs. penalty minutes
6. What is the equation for best line of fit for Average time on Ice vs. Penalty Minutes
y=2.14x+4.47
y=2.14x+4.47
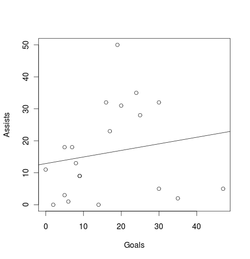
7. Create a scatterplot of number of goals vs. number of assists
8. What is the mean number of goals made by offense
59 Goals
9. What is the mean number of assists made by defensemen?
12 Assists
10. Histogram of ATOI:
8. What is the mean number of goals made by offense
59 Goals
9. What is the mean number of assists made by defensemen?
12 Assists
10. Histogram of ATOI:
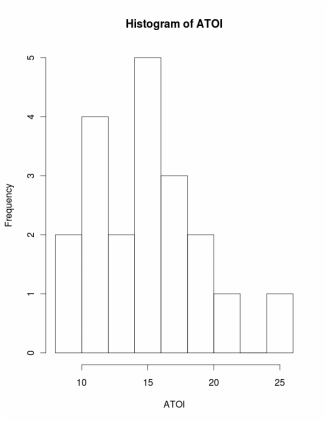
The average time on the ice of the 20 players is 15 minutes.
Links: http://bruins.nhl.com/club/stats.htm
Links: http://bruins.nhl.com/club/stats.htm
