Boston Neighborhoods
Case Study by Ana Mendez and Grace Mann and Daniel Hines

Overview
This study investigated the effect of having only a high school diploma on the different economic factors of a neighborhood. This case study attempted to show a correlation between a lower level of completed education and other economic components of a neighborhood. We used data from the census from four different neighborhoods: South Boston, Allston-Brighton, Jamaica Plain, and Mattapan.
References
"Boston, Massachusetts." (MA) Profile: Population, Maps, Real Estate, Averages, Homes, Statistics, Relocation, Travel, Jobs, Hospitals, Schools, Crime, Moving, Houses, News. N.p., n.d. Web. 07 May 2014.
Questions
1. What is the correlation between violent crime and having only a high school diploma?
0.875
2. What is the independent variable of this experiment?
% of people with only a high school diploma
3.Create a scatter plot of the percentage of people with only a high school diploma and the percentage of people living below the poverty line.
0.875
2. What is the independent variable of this experiment?
% of people with only a high school diploma
3.Create a scatter plot of the percentage of people with only a high school diploma and the percentage of people living below the poverty line.
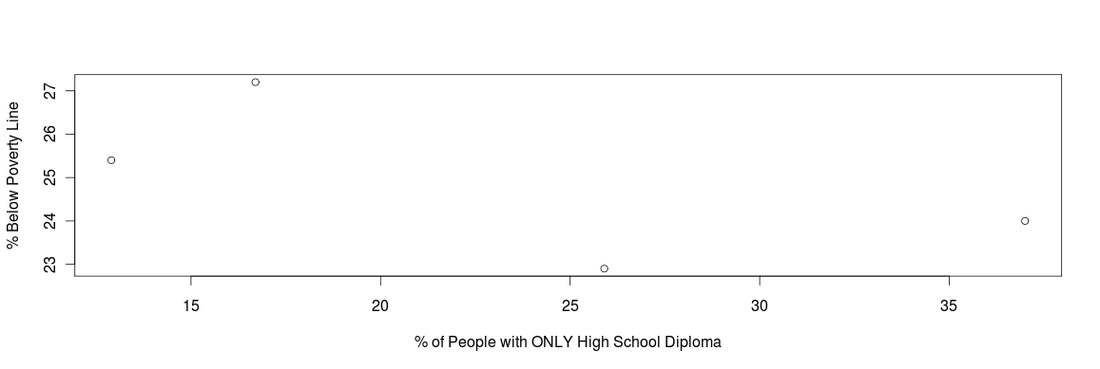
4. What is the least squared regression line for the above plot?
-0.1096
-0.1096
5. Create a box plot representing the median household incomes of the four neighborhoods
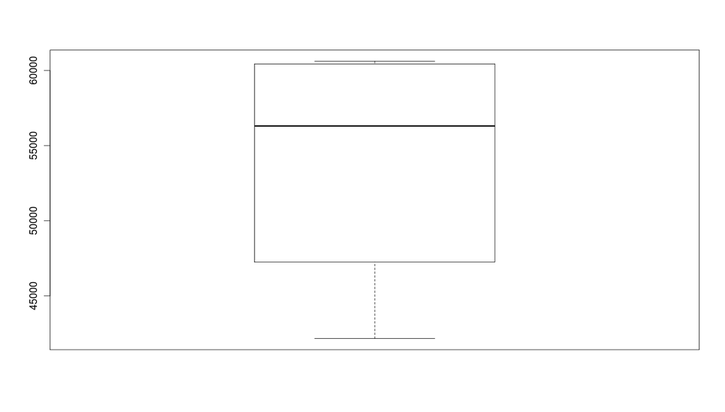
6. What are the lower quartile and upper quartile of the box plot?
Lower Quartile: 47,263
Upper Quartile: 60,441.5
7. What is the correlation between having only a high school diploma and household income?
-0.7300691
8. What is the standard deviation for the percentage of people living below the poverty line and the percentage of those with only high school diplomas?
5%
9. Create a scatter plot of the percentage of people with only a high school diploma and the median household incomes of .
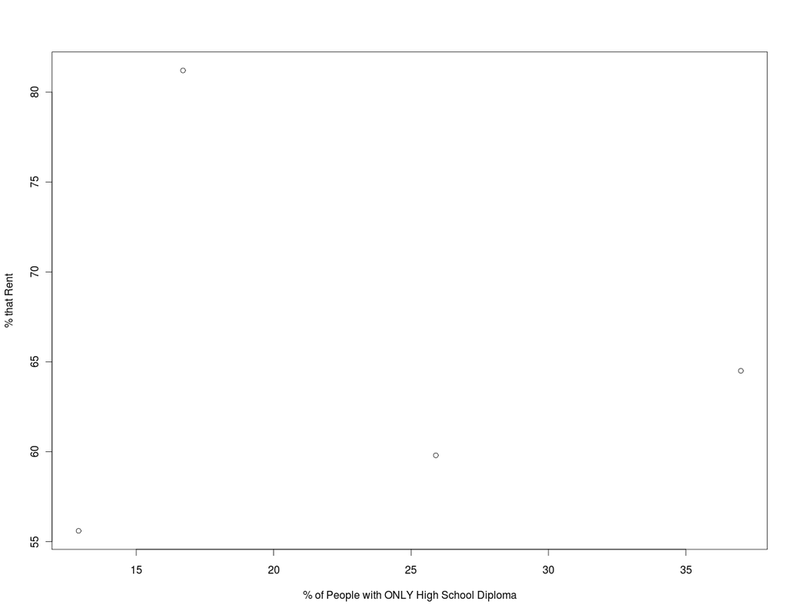
10. What is the equation for the percentage of people with only a high school diploma and those who rent?
y=-0.08478x+67.23551
y=-0.08478x+67.23551
