Time is Up by Elise Cole, Ashlie Chan, and Lorenz Graham Section 05
Time statistics for high school students.
Daily Boulder Daily Camera Copyright © 2014 Boulder Daily Camera
We personally surveyed 60 BLS senior students in May 2014 questions.
HWTime and Social Media
Questions:
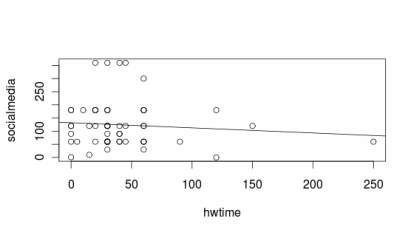
1. Create a scatterplot for homework time vs. time spent on social media. Add linear regression line.
2. What is the correlation of the graph?
-.1944
1. Create a scatterplot for homework time vs. time spent on social media. Add linear regression line.
2. What is the correlation of the graph?
-.1944
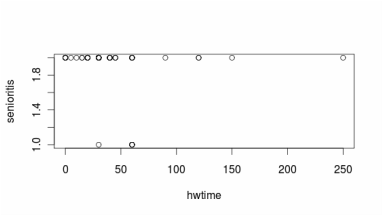
3. Create another scatter plot for homework time vs. if a students believes they have senioritis. Add linear regression line.
4. What is the formula of the linear regression, and correlation of these two data sets?
yhat = 132.1x - 0.194
4. What is the formula of the linear regression, and correlation of these two data sets?
yhat = 132.1x - 0.194
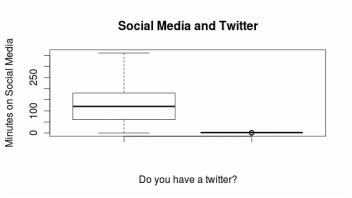
5. Create a boxplot of students who do/do not have a twitter vs. time spent on social media.
6. Compare the means of both sets, which one is higher?
The mean is higher for people who have a twitter because they are on social media more often.
6. Compare the means of both sets, which one is higher?
The mean is higher for people who have a twitter because they are on social media more often.
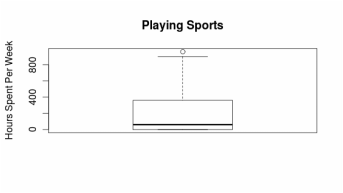
7. Create a boxplot of the time students spent playing sports per week (in hours). What is the average time spent?
The average time spent is 226 minutes a week playing sports
The average time spent is 226 minutes a week playing sports
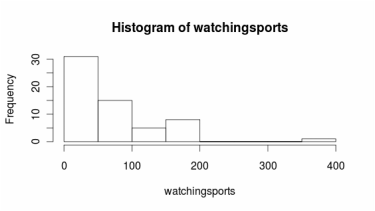
8.Create a histogram of the amount of time students spend watching sports per day. How is it skewed?
The histogram is skewed right.
The histogram is skewed right.
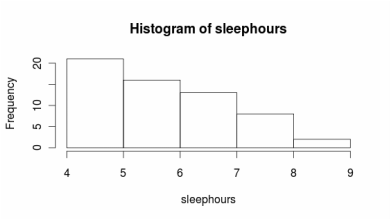
9. Create a histogram of how many hours each student spends sleeping. How is it skewed?
The histogram is skewed right.
The histogram is skewed right.
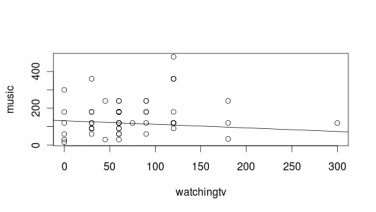
10. Create a scatterplot comparing time spent watching tv vs. time spent listening to music. Add linear regression.
yhat = 132.05x - 0.194
yhat = 132.05x - 0.194
