Panera Breads Nutrition Facts
OVERVIEW: The purpose of this was to research the nutrition of panera bread's bread. We researched eighteen different breads and we looked into eleven different components relating to each different type of bread. Our research was based off of a serving size of two ounces.
Questions to Answer: How nutritional are Panera breads? What nutritional value do they have?
Description of Variables: Serving size in ounces; fat, saturated fat, trans fat, carbs, fibers, sugars, and protein are all in grams; and cholesterol and sodium are in milligrams.
Reference Website: https://www.panerabread.com/content/dam/panerabread/documents/nutrition/Panera-Nutrition.pdf
| panera_bread_data.txt |

http://daymtastic.com/tag/panera-bread/
Questions
1. What is the correlation between sugars and sodium?
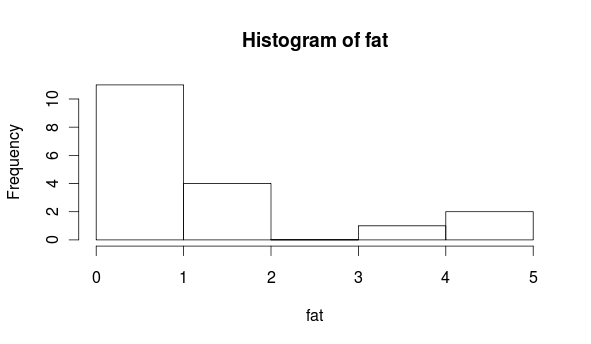
2. Make a histogram of fat contents.
3. What is the mean number of calories?
4. What is the correlation between calories and carbohydrates?
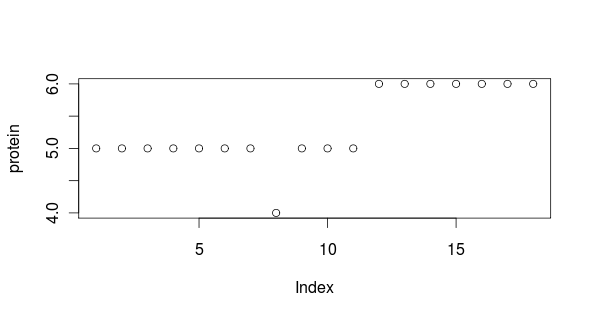
5. Create a scatterplot of protein contents.
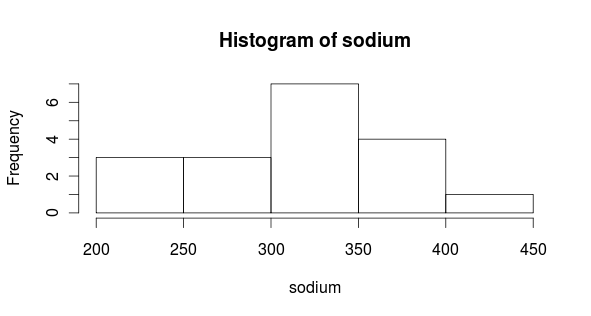
6. Make a histogram of sodium contents.
7. Is the data for question 6 skewed left, right or symmetric?
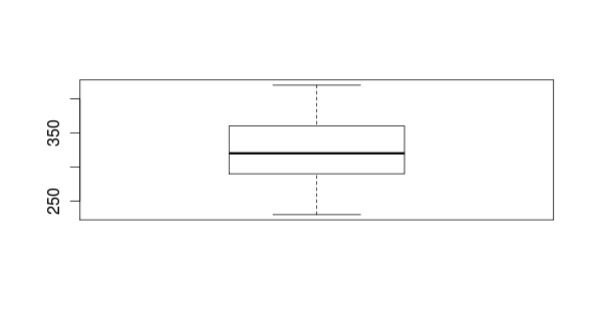
8. Create a boxplot of sodium contents.
9. What is the first quartile from question 8?
10. What is the third quartile from question 8?
1. What is the correlation between sugars and sodium?
2. Make a histogram of fat contents.
3. What is the mean number of calories?
4. What is the correlation between calories and carbohydrates?
5. Create a scatterplot of protein contents.
6. Make a histogram of sodium contents.
7. Is the data for question 6 skewed left, right or symmetric?
8. Create a boxplot of sodium contents.
9. What is the first quartile from question 8?
10. What is the third quartile from question 8?
Answers
1. Correlation = -0.55
2.
3. Mean= 146.11 calories
4. Correlation= -0.06
5. Scatterplot of Protein
6. Histogram of Sodium
7. Symetric
8. Boxplot of Sodium
9. 1st quartile= 290
10. 3rd quartile= 360
1. Correlation = -0.55
2.
3. Mean= 146.11 calories
4. Correlation= -0.06
5. Scatterplot of Protein
6. Histogram of Sodium
7. Symetric
8. Boxplot of Sodium
9. 1st quartile= 290
10. 3rd quartile= 360
