Years of Education and HIV Prevalence Among Women in 5 African Countries
Research conducted by: Jane Fortson (2008, see reference below)
Case study prepared by: Bryce Ivan Fisher, Kayla Regan & Harry Xue
Case study prepared by: Bryce Ivan Fisher, Kayla Regan & Harry Xue
Overview
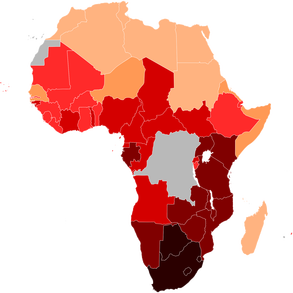
The journal article on which this study was based investigated the relationship between HIV and socioeconomic status in Sub-Saharan Africa. This case study focused specifically on the relationship between average years of education and HIV prevalence among women in 5 African countries. The author found that in these countries, surprisingly there appears to be a positive correlation between level of education and HIV prevalence, meaning that higher educated respondents were actually more likely to have HIV.
The data was collected from from the Demographic and Health Surveys (DHS) for Burkina Faso (2003), Cameroon (2004), Ghana (2003), Kenya (2003), and Tanzania (2003). The surveys included an HIV test, for which the response rates were 89.3% in Burkina Faso, 91.0% in Cameroon, 84.9% in Ghana, 73.4% in Kenya, and 80.5% in Tanzania. Refusal to take the test constituted most of the non-responses. The women interviewed for the surveys were between the ages of 15 and 49.
Questions to Answer
Is there a correlation between average years of education and HIV prevalence among African women?
Data
Download Here
Variables
years.full - Mean years of education in full sample
size.full - Size of full sample
years.hiv - Mean years of education in the HIV positive subgroup
size.hiv - Number of HIV positive women
hivpos- The proportion of women who tested positive for HIV
References
J Fortson, "The gradient in sub-Saharan Africa: socioeconomic status and HIV/AIDS," Demography, vol 45(2), pp. 303-22, May 2008.
Exercises
1. Create a histogram for the prevalence of HIV among women in the five countries. Is the data skewed left, right or symmetrical?
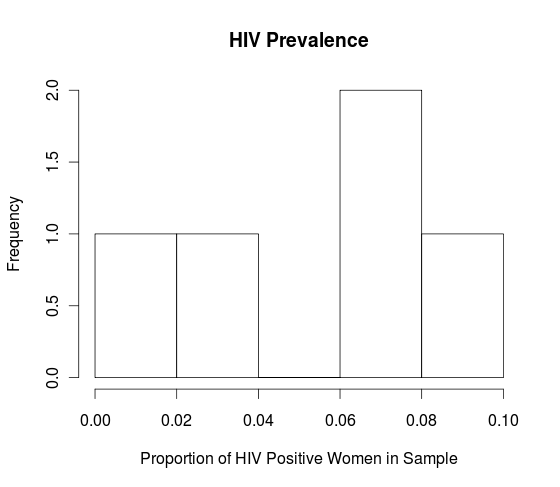
The data is not skewed left, skewed right, or symmetric. There is no pattern.
2. Create a stem and leaf plot for the prevalence of HIV among women in the five countries.
The decimal point is 2 digit(s) to the left of the |
0 | 8
2 | 7
4 |
6 | 67
8 | 7
3. What is the five number summary of the prevalence of HIV in the five countries?
Minimum: 0.018 Q1: 0.0225 Median: 0.066 Q3: 0.0820 Maximum: 0.087
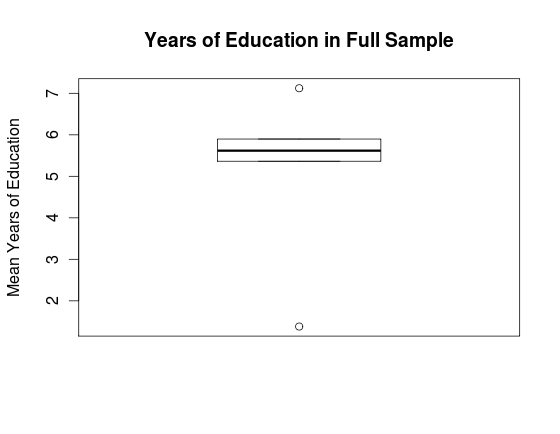
4. Construct a boxplot for the mean years of education among women in the five countries.
2. Create a stem and leaf plot for the prevalence of HIV among women in the five countries.
The decimal point is 2 digit(s) to the left of the |
0 | 8
2 | 7
4 |
6 | 67
8 | 7
3. What is the five number summary of the prevalence of HIV in the five countries?
Minimum: 0.018 Q1: 0.0225 Median: 0.066 Q3: 0.0820 Maximum: 0.087
4. Construct a boxplot for the mean years of education among women in the five countries.
5. What is the variance in the prevalence of HIV the five countries?
0.0009455
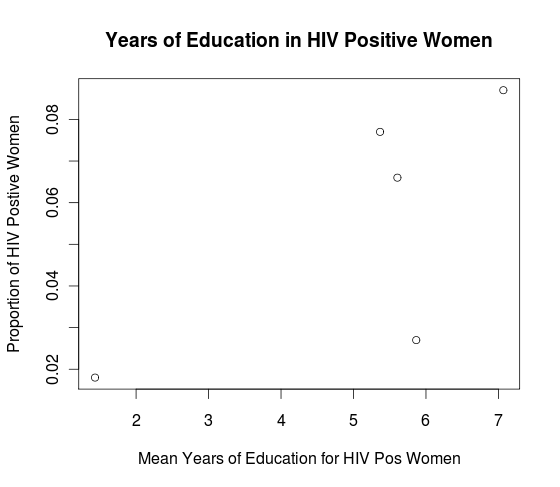
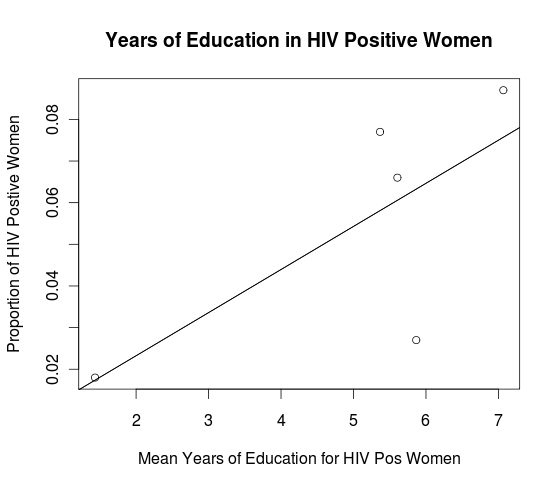
6. Make a graph with HIV prevalence on the y-axis and average number of years of education for the HIV positive group on the x-axis. What do you notice?
There appears to be a positive correlation between average years of education and HIV prevalence.
0.0009455
6. Make a graph with HIV prevalence on the y-axis and average number of years of education for the HIV positive group on the x-axis. What do you notice?
There appears to be a positive correlation between average years of education and HIV prevalence.
7. What is the dependent variable and what is independent variable?
Proportion of HIV Positive Women is the dependent variable while Mean Years of Education is the independent variable.
8. Plot the line of best fit for this graph. What is the correlation?
0.7184733
Proportion of HIV Positive Women is the dependent variable while Mean Years of Education is the independent variable.
8. Plot the line of best fit for this graph. What is the correlation?
0.7184733
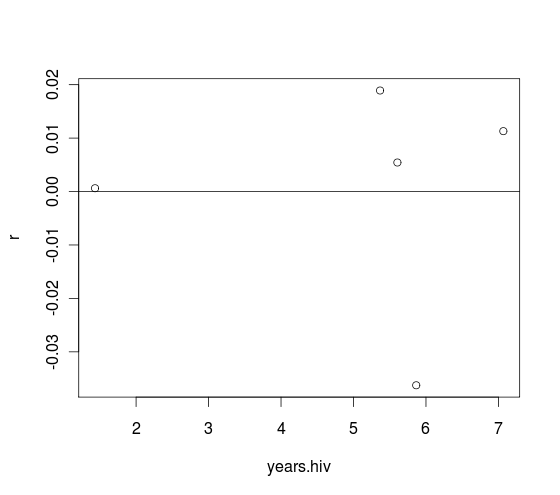
9. Create a residual plot.
10. Conduct a matched pairs test to determine whether there is a significant difference in average years of education between the full sample and the HIV positive subgroup.
The null hypothesis is that there is no difference between the average years of education between the full sample and the HIV positive subgroup.
The alternative hypothesis is that the difference between the average years of education between the full sample and the HIV positive subgroup is greater than 0.
xdiff= 0.008
t = 0.008/(0.0409/5)
= 0.98
p = 0.81 > 0.05
We fail to reject the null hypothesis that there is no difference between the average years of education between the full sample and the HIV positive subgroup.
