Weight Of Children Based On Weight of Income Per State

Purpose
See if there is a correlation between the weight of a child (which includes their health because of this excessive weight) and the income of his or her family.
See if there is a correlation between the weight of a child (which includes their health because of this excessive weight) and the income of his or her family.
| statsfinalproject.csv |
Overview:
The purpose of this project was to figure out the relationship between Obesity in children per state to other factors. According to National Conference of State Legislation they believed that the obesity rates in America has increase gradually over the years. They collected data and through the data from the National Survey of Children's Health as well as the Center for Disease Control and Prevention they conducted that the obesity rates are higher in kids ranged from 2-19 year old.((NHANES,2014) The adult obesity rate stayed mostly the same during the recent years. We took data from the National Survey of Children's Health and used it in our project. The data consist of every state in the United States along with the percentage of overweight (85th to 94 percentile)kids between the age of 2-19 years old and those who are obese (95th percentile of above). We look at different factors such as Median Income per Household, Per Capita Income, Population size, as well as Death Rate per 100000 for every state. We want to see if there was any correlation or relationship between these factors and the obesity percentages for children. There is a growing concern for the obesity rate in child and right now the government is stepping in to help. Schools are not allow to sell junk food to student, that includes the ban of soft drinks, and much more.(Fox59,2014) Healthier lunches are provide to students. Even in some states there is a ban on selling soft drinks in convient stores. But is this the right approach to help stop child obesity? Is there some other factor that should be looked at more carefully?
Variables: Amount of overweight children per state
Diabetes Death Rate per State
Median Household Income per State
Population Per State
Amount of Obese Children per State
Diabetes Death Rate per State
Median Household Income per State
Population Per State
Amount of Obese Children per State
Question to Answer: What variable has the greatest correlation to Obesity in children per state?
Diabetes death rate per 100000 has the greatest correlation to obesity in children per state.
1.What is the relationship between median household income to amount of obese children per state?
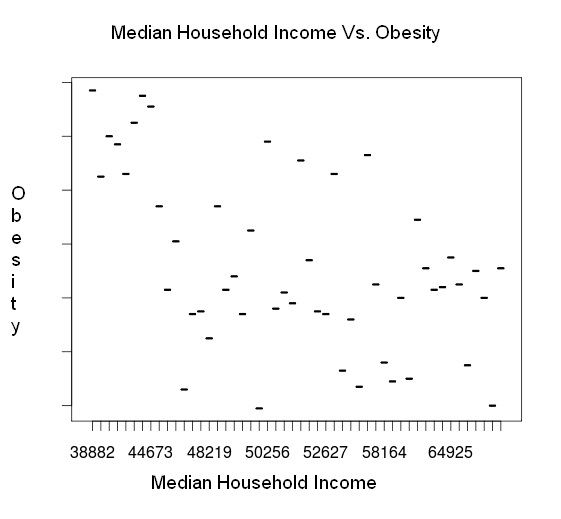
2. Is there any correlation between the Median Household Income and the amount of Obesity Child Per State?
There does not seem to be any apparent correlation between these two.
3.What is the least-square regression line equation for the data above?
4.What is the relationship between population and the percentage of overweight children? Create a scatter plot.
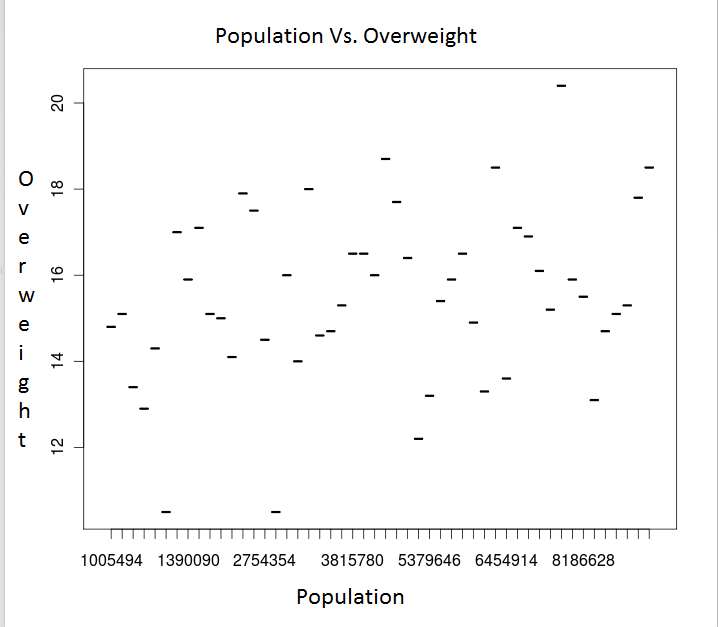
5.Does there appear to be any relationship between these two variables?
The data is more skewed to the right.There is one outlier.
6.Make a scatter plot between the relationship of overweight children vs. the median household income per state.
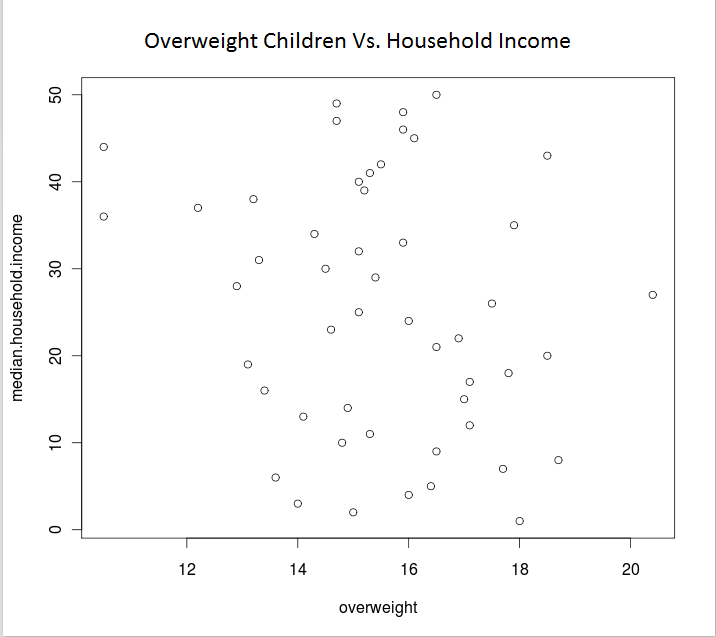
7.What is the correlation between these two variables?
-0.208
-0.208
8.What can you conclude about the relationship between these two variables?
The graph seems to show that there may be a slight relationship between these two variables. It appears as though the greatest number of overweight children have a greater median income but there are of course many outliers since this data isn't perfect and there are always exceptions to everything.
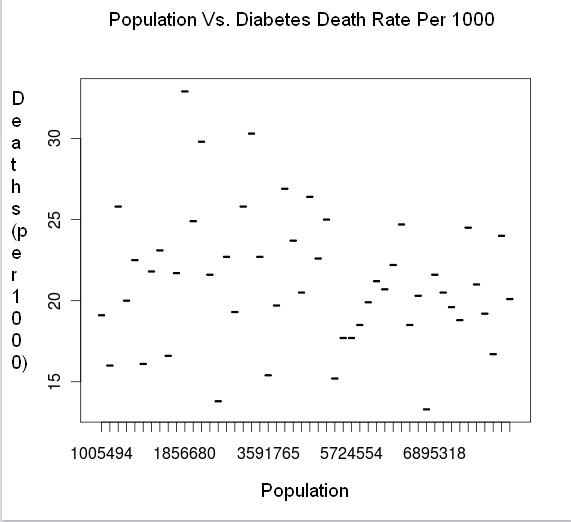
9.Create a scatter plot for the relationship between population and the amount of diabetes death rate per 100000. Is there any notable relationship?
The relationship between population and the amount of diabetes death rate per 100000 is that it is very diverse. From the scatter plot you can see that in a few cases, that in the lower population there are higher diabetes death rate per 100000. Those can be the outliers. And then there are some with a low population rate with really low diabetes death rate per 100000 as well. It just really depends on each individual state. So these are independent variables.
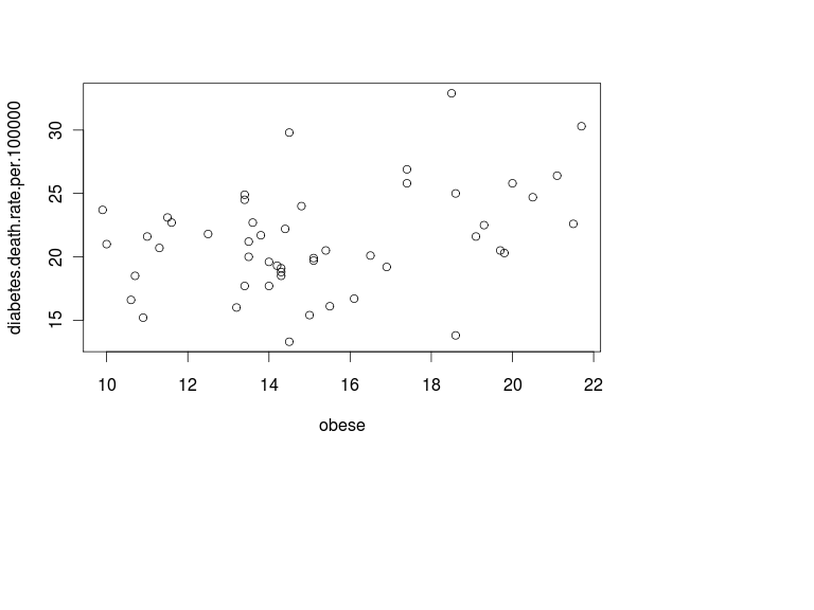
Question Number 10.
Create a scatter plot between the amount of overweight children and the diabetes death rate per 1000. What is the correlation?
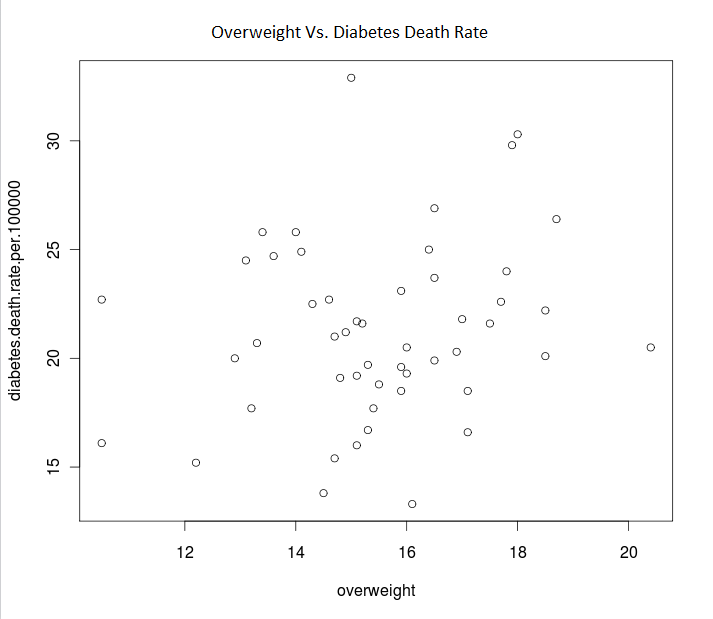
Correlation: 0.2013223
