The 25 Countries
1. Create a linear regression line that models the population size and GDP.
Coefficients: (Intercept) Pop. 1.353e+03 4.409e-06
Coefficients: (Intercept) Pop. 1.353e+03 4.409e-06
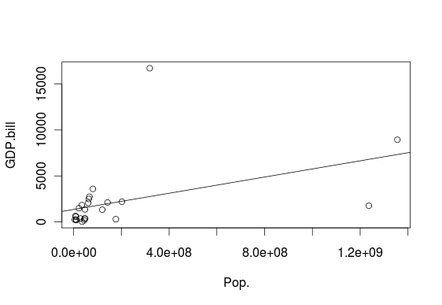
2. What is the correlation between them?
correlation: 0.4310719
correlation: 0.4310719
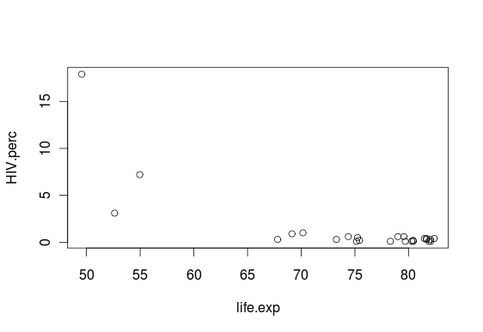
3. Plot a scatter plot of life expectancy and HIV percentage.
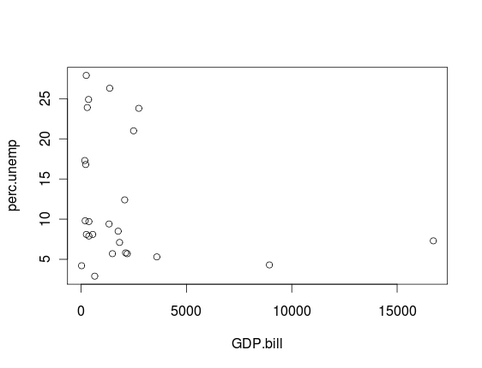
4. Plot a scatter plot GDP and percentage unemployed.
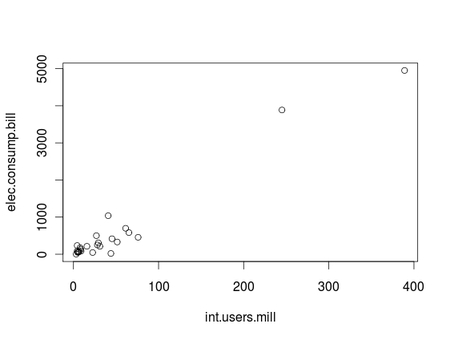
5 Plot a scatter plot internet users and electricity consumption.
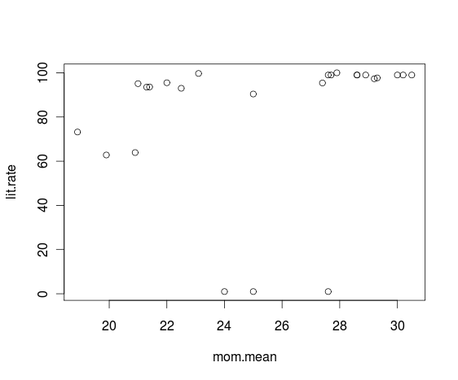
6. Plot a scatter plot mother’s mean age at first birth vs. literacy rate.
7. Is there any correlation between the population living in poverty and the percentage of people living with HIV?
There is a 0.2302316 correlation. It has a weak positive correlation.
8. What’s the mean population?
167609183.4 is the mean population of the 25 countries we selected.
There is a 0.2302316 correlation. It has a weak positive correlation.
8. What’s the mean population?
167609183.4 is the mean population of the 25 countries we selected.
9. Create a histogram of literacy rate.
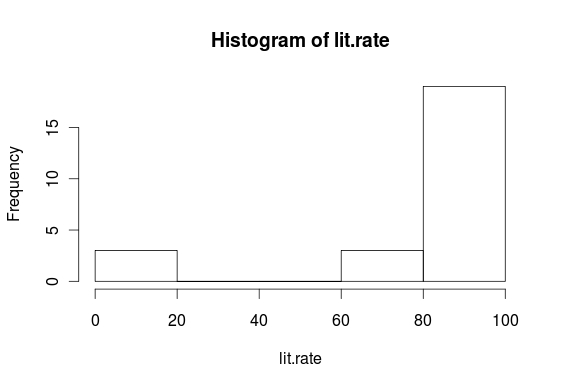
10. Does the data appear to be symmetrical, skewed right, or skewed left?
Skewed left.
Skewed left.
