The Relationship Between Farm Acreage Used for Fruit and Nut Farming, Average Temperature, Average Farm Size (by State), Median Income, and Average Family Size in 2004
Below are several data sets that take information from each of the 50 states. The questions that follow help to determine whether or not there is a relationship from these sets of data.
NOTE
"Fruit farm size" refers to the total acreage in each state used to farm fruit.
"Average yearly temperature" refers to the average temperature taken (in Fahrenheit) from 12 months in a year.
"Average farm size" refers to the average acreage of a farm in each state.
State Fruit Farm Size (Acres) Average Yearly Temperature Average Farm Size (Acres) Median Income Family Size
Alabama 0 62.8 198 44334 3.02
Alaska 0 27 1452 36629 3.21
Arizona 1720 60.3 2588 55063 3
Arkansas 256 60 303 43846 3
California 51115 59.4 347 34984 3
Colorado 366 45.1 1000 49222 3.08
Connecticut 20 49 86 50886 3.08
Delaware 0 55.3 230 55100 3.06
Florida 6732 70.7 235 48049 3
Georgia 60 63.5 218 43451 3.17
Hawaii 1001 70 236 40535 3
Idaho 41 44.4 472 40984 3.16
Illinois 2 51.8 377 56242 3.2
Indiana 29 51.7 253 44358 3.05
Iowa 19 47.8 358 46077 2.97
Kansas 0 54.3 732 42329 3.06
Kentucky 0 55.6 162 43391 2.98
Louisiana 14 66.4 289 41066 3.1
Maine 907 41 190 35610 2.83
Maryland 19 54.2 169 36429 3.15
Massachusetts 397 47.9 85 41329 3.08
Michigan 906 44.4 190 57103 3.05
Minnesota 23 41.2 346 52019 3.05
Mississippi 0 63.4 262 42256 3.11
Missouri 2 54.5 284 56104 3
Montana 89 42.7 2146 34755 2.91
Nebraska 2 48.8 950 42137 3.04
Nevada 92 49.9 2100 33956 3.2
New Hampshire 8 43.8 132 43786 2.96
New Jersey 44 52.7 83 47204 3.22
New Mexico 162 53.4 2554 56815 3.13
New York 392 45.4 211 55275 3.2
North Carolina 6 59 173 39562 3.01
North Dakota 0 40.4 1300 44649 2.91
Ohio 44 50.7 189 40238 3.01
Oklahoma 75 59.6 404 39220 3.04
Oregon 2104 48.4 430 43055 3
Pennsylvania 99 48.8 132 39614 3.02
Rhode Island 4 50.1 71 40994 3.04
South Carolina 0 62.4 199 44106 3.01
South Dakota 7 45.2 1386 47935 3
Tennessee 2 57.6 136 38691 3.01
Texas 1419 64.8 568 41107 3
Utah 1 48.6 758 38072 3.56
Vermont 356 42.9 195 41397 2.85
Virginia 1 55.1 189 50871 3.02
Washington 11980 48 434 47329 3
West Virginia 0 51.8 173 51141 3.04
Wisconsin 192 43.1 203 49922 3
Wyoming 0 42 3743 33373 3.03
10 STATISTICAL QUESTION$
1. What is the average size for fruit farms by state?
A: 1614.16 acres
2. What is the median family size?
A: 3.025
3. Is there a strong correlation between average yearly temperature and average fruit farm size?
A: Since the correlation value is 0.15, no, there is not a strong correlation.
4. What is the first quartile of the family size data?
A: 3
5. What is the third quartile of the family size data?
A: 3.08
6. Make a histogram for the average temperature data.
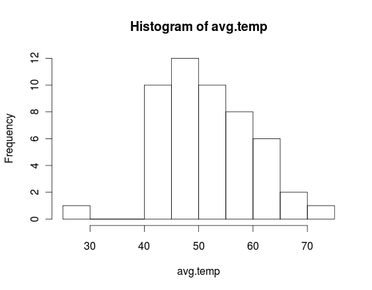
7. What is the IQR for the average temperature data?
45.25
8. Is the average temperature data skewed in any way?
Yes, it is skewed to the left.
9. Is there a strong correlation between median income and family size?
The correlation value is 0.03, so no, there is not a strong correlation.
10. Create a plot of average fruit farm size and average farm size. Is there a correlation between the two?
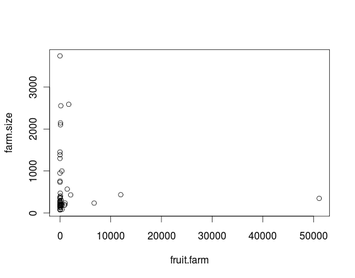
As shown by the graph, there is no correlation between the two data sets.
WORKS CITED"Average Annual Temperature for Each US State." Average Annual Temperatures by USA State. Current Results Nexus, 2004. Web. 07 May 2014.
"Income." State Median. United States Census Bureau, n.d. Web. 07 May 2014.
"States by Average Farm Acreage - 2004." Farms. United States Department of Agriculture, 2004. Web. 07 May 2014.
"U.S. Average Family Size State Rank." Based on US Census 2010 Data. World Media Group, n.d. Web. 07 May 2014.
"USDA ERS - Organic Production." USDA ERS - Organic Production. United States Department of Agriculture, 27 Sept. 2013. Web. 07 May 2014.
Image: http://commons.wikimedia.org/wiki/File:Florida_orange_grove.JPG
