Falmouth Climate Monthly Reports

Research Conducted By: Richard E. Payne
Project Done By: Nya Gavin and Caitlyn Berry
Overview:
Reports have been taken everyday since 1991 on the climate of Falmouth, MA. The data is collected using an Eppley PSP pyranometer, which is mounted on three buildings. Solar radiation varies throughout the year, therefore data is collected everyday. Solar radiation depends on clouds, latitude, time of year, and time of day. The data is used to compare atmospheric effects of different locations.
Data Set
Explanation of Data
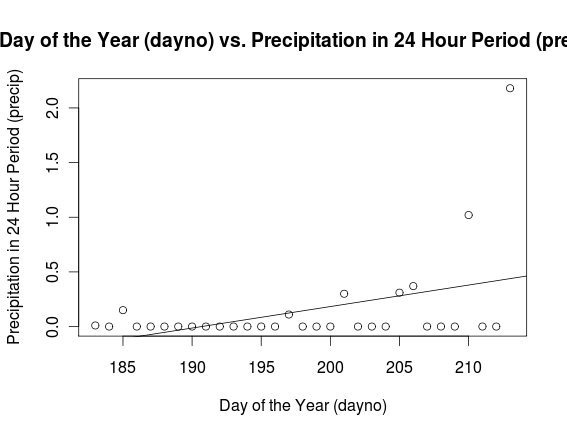
1. Create a scatter plot for Day of the Year (dayno) vs. Precipitation in 24 Hour Period (precip). Add a linear regression line.
2. What is the correlation?
correlation: 0.417
2. What is the correlation?
correlation: 0.417
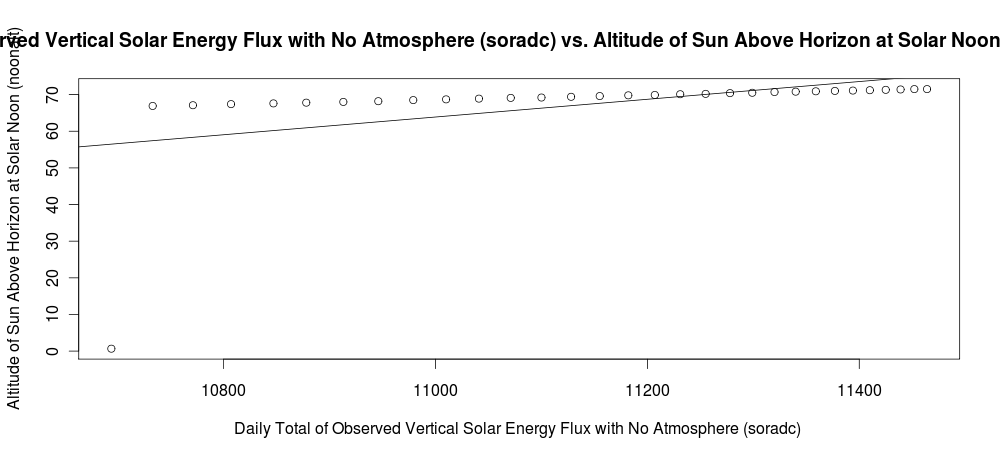
3. Create a scatter plot for Daily Total of Observed Vertical Solar Energy Flux with No Atmosphere (soradc) vs. Altitude of Sun Above Horizon at Solar Noon (noonalt). Add a linear regression line.
4. What is the formula of the linear regression?
y= -202.23x + 0.024
4. What is the formula of the linear regression?
y= -202.23x + 0.024
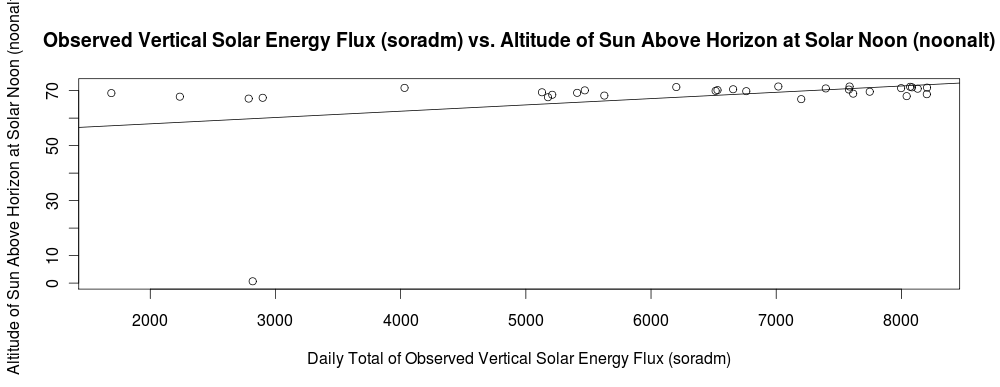
5. Create a scatterplot for Daily Total of Observed Vertical Solar Energy Flux (soradm) vs. Altitude of Sun Above Horizon at Solar Noon (noonalt). Add a linear regression line.
6. What are the median of both data sets?
soradc: 1.62
soradm: 1.009
6. What are the median of both data sets?
soradc: 1.62
soradm: 1.009
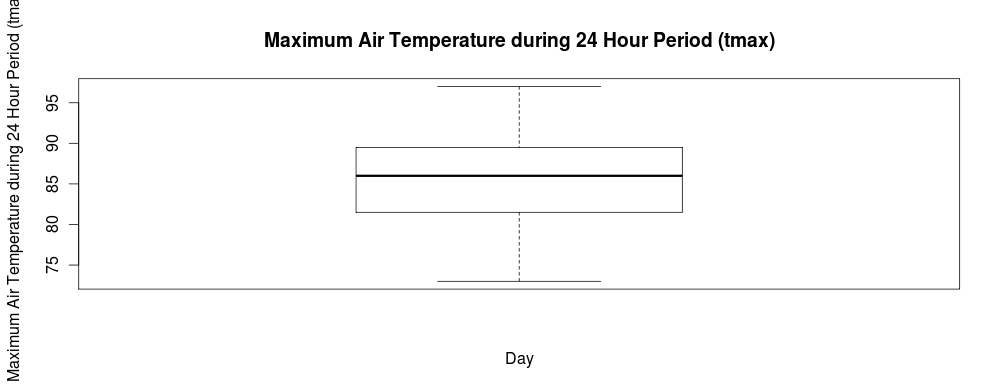
7.Create a boxplot for Maximum Air Temperature during 24 Hour Period (tmax)?
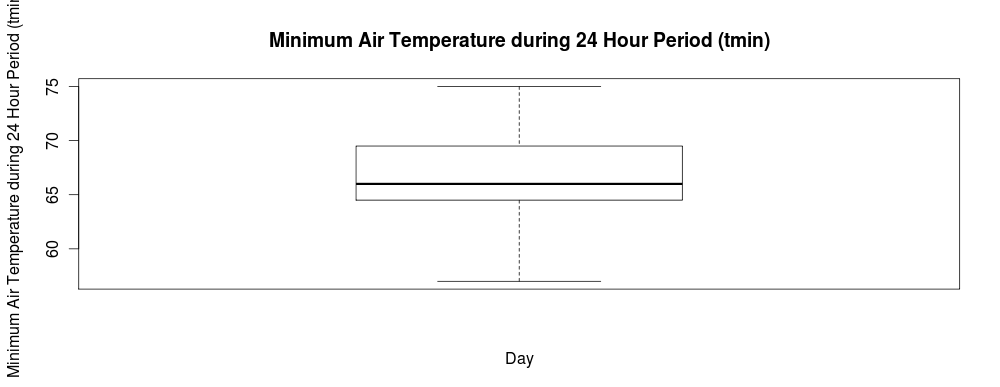
8.Create a boxplot for Minimum Air Temperature during 24 Hour Period (tmin)?
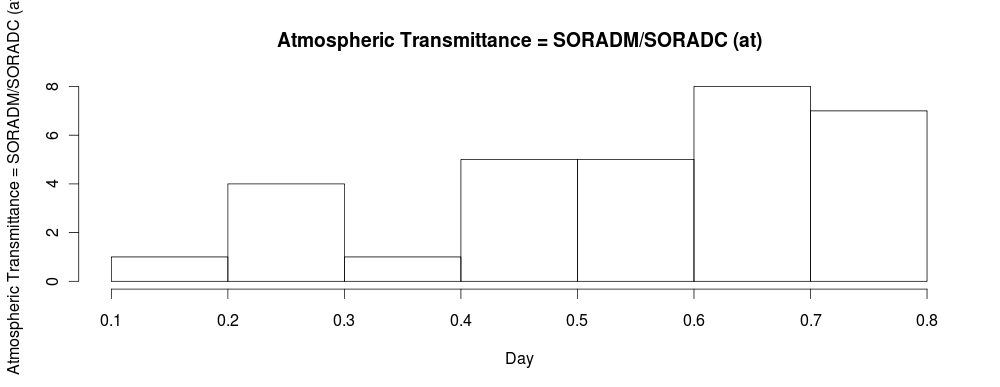
9. Create a histogram of Atmospheric Transmittance = SORADM/SORADC (at)? How is the data skewed?
Data is symmetric
10. What is the median of the Atmospheric Transmittance, first quartile, and third quartile?
median: -0.17
first quartile: -5.04
third quartile: 5.48
Data is symmetric
10. What is the median of the Atmospheric Transmittance, first quartile, and third quartile?
median: -0.17
first quartile: -5.04
third quartile: 5.48
Reference: "Falmouth Monthly Climate Reports." Falmouth Monthly Climate Reports. N.p., July 2012 [Online]. Available: <http://cis.whoi.edu/science/PO/climate/index.cfm>. Accessed May 8, 2014
