Demographics of Smokers between Year 2007 and 2008
Research conducted by the Centers for Disease Control (CDC)
Case study prepared by: Deirdre McKenna, and Ericson Ortiz
Case study prepared by: Deirdre McKenna, and Ericson Ortiz
Overview
This case study is used to analyze data that the CDC gathered from 2007-2008. With the data they provided, we analyzed their table: Percentage of persons aged ≥18 years who were current cigarette smokers,* by sex and selected characteristics — National Health Interview Survey, United States, 2007 and 2008. The CDC determined whether an individual was more likely to smoke given their certain characteristics, for example, their ethnicity, income, education level, gender, and age. Our study reviewed their data by representing them as visual graphs as to make them more easily interpreted by our audience. This website compares various demographics against one another and measures the changes over the period of 2007 and 2008.
Question to Answer:
Which demographic has the most risk at being smokers? Is this statistically significant?
Design Issues:
The population of our study had 22990 people in 2007, and then 21525 people in 2008. Either some deaths occurred, the study participants were never contacted, or they quit smoking.
Description of Variables
The different demographics of smokers represented in this data are:
Total smokers in the population
Female smokers
Male smokers
American Indian
American Asian
Above the poverty level
Below the poverty level
High school graduate
Undergraduate degree
Eighteen to Twenty-five years old
Forty-five to Sixty-four years old
Total smokers in the population
Female smokers
Male smokers
American Indian
American Asian
Above the poverty level
Below the poverty level
High school graduate
Undergraduate degree
Eighteen to Twenty-five years old
Forty-five to Sixty-four years old
References
1. "Cigarette Smoking Among Adults and Trends in Smoking Cessation — United States, 2008". Retrieved May , 2014 Available: http://www.cdc.gov/mmwr/PDF/wk/mm5844.pdf
2. Sandel, M , "Why do poor people smoke more?". Retrieved May , 2014 Available: http://www.cnn.com/2014/03/26/opinion/sandel-poverty-smoking/
2. Sandel, M , "Why do poor people smoke more?". Retrieved May , 2014 Available: http://www.cnn.com/2014/03/26/opinion/sandel-poverty-smoking/
Exercises
1. What are the independent variables? What are the dependent variables?
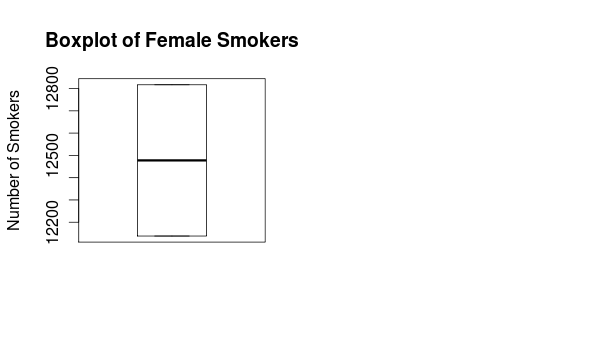
2. Create a boxplot of female smokers from 2007 to 2008.
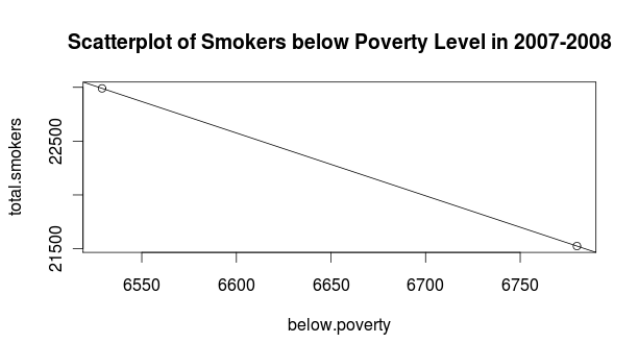
3. From the 2007 and 2008 data, create a scatterplot of total smokers and smokers below the poverty level. What does this graph say about the total smokers who are below the poverty level?
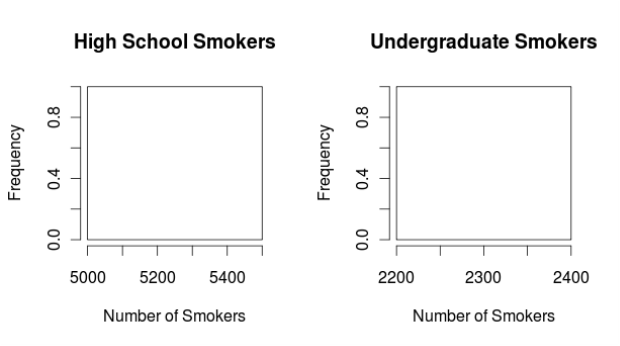
4. Create a side-by-side histogram comparison of high school graduate and undergraduate smokers in 2008.
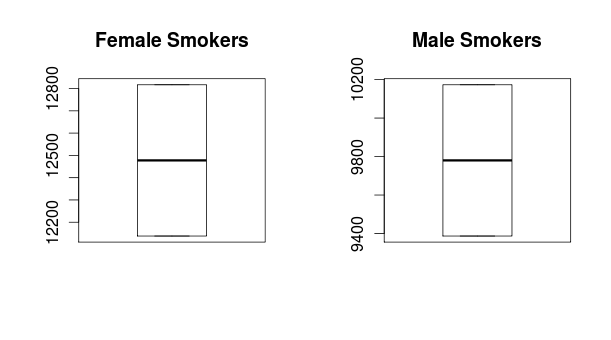
5. Create a side-by-side boxplot comparison of female and male smokers from 2007 2008.
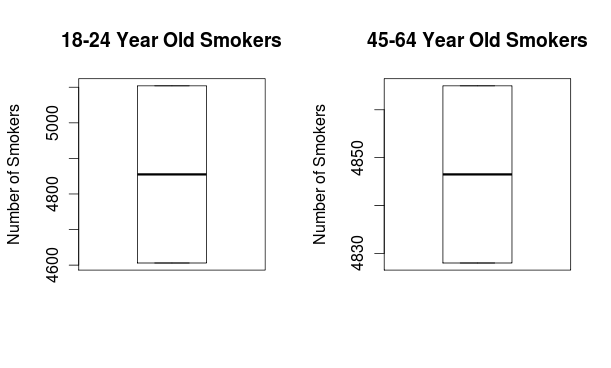
6. Create a side-by-side boxplot comparison of 18-25 vs. 45-64 year olds in the year 2007.
7. In the year 2008, what percentage of total smokers are American Indian? American Asian?
8. What is the standard deviation of error for smokers who are American Indian and American Asian?
9. What is the sample proportion of smokers who are below the poverty level in 2008?
10. If the true proportion of smokers below the poverty level is equal to the answer you got in Question #9, what is the probability that the sample is at most 0.32?
2. Create a boxplot of female smokers from 2007 to 2008.
3. From the 2007 and 2008 data, create a scatterplot of total smokers and smokers below the poverty level. What does this graph say about the total smokers who are below the poverty level?
4. Create a side-by-side histogram comparison of high school graduate and undergraduate smokers in 2008.
5. Create a side-by-side boxplot comparison of female and male smokers from 2007 2008.
6. Create a side-by-side boxplot comparison of 18-25 vs. 45-64 year olds in the year 2007.
7. In the year 2008, what percentage of total smokers are American Indian? American Asian?
8. What is the standard deviation of error for smokers who are American Indian and American Asian?
9. What is the sample proportion of smokers who are below the poverty level in 2008?
10. If the true proportion of smokers below the poverty level is equal to the answer you got in Question #9, what is the probability that the sample is at most 0.32?
Rweb
Dataset URL: https://docs.google.com/spreadsheets/d/18tmHnbBuV1JErqXsqFWUeitZf-qJVF6o_mQvXecw--4/edit#gid=0
1. The independent variables are the years 2007, and 2008. The dependent variables are the female, male, American Indian, American Asian, Above the poverty level, Below the poverty level, High school graduate, Undergraduate degree, and 18-25 years old, and 45-64 years old.
2.
1. The independent variables are the years 2007, and 2008. The dependent variables are the female, male, American Indian, American Asian, Above the poverty level, Below the poverty level, High school graduate, Undergraduate degree, and 18-25 years old, and 45-64 years old.
2.
3.
4.
5.
6.
7. Number of American Indian smokers out of the total population are 6974/21525
Number of American Asian smokers out of the total population are 2131/21525
The proportion of Amercian Indian smokers out of the population of smokers is .323.
The proportion of American Asian smokers out of the total population is .099.
8. Standard Error American Indian = √[(.323)(1-.323)/(21525)] = .00318, or 0.32%.
Standard Error American Asian = √[(.099)(1-.099)/(21525)] = 0.00203, or 0.20%
9. Sample proportion of smokers below poverty level = 6780/21525 = 0.31498, or 0.315
10. SD of smokers below poverty level = √[(.315)(1-.315)/(21525)] = 0.003
P(Z ≤ [(0.32 - .315) /(.003)] = Z-score = 1.666, = .4515. The probability that the sample proportion is at most 0.32 is 0.4515.
