Energy sources: United States vs. Latin America

Data source: http://sustainabilityreport.duke-energy.com/2011/environmental-footprint/environmental-performance-metrics/
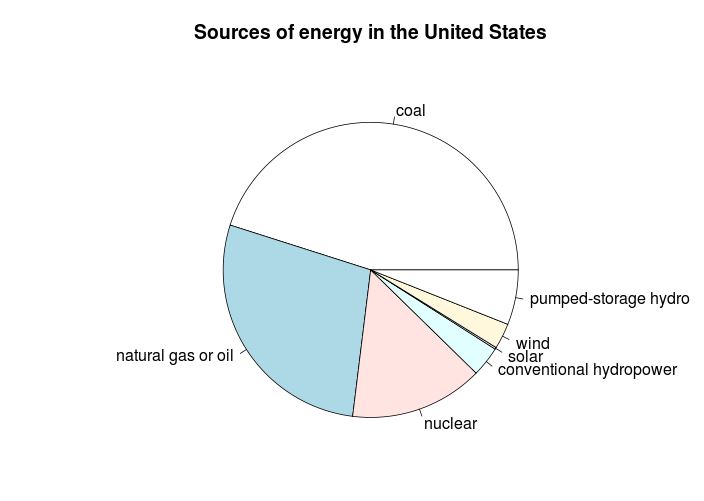
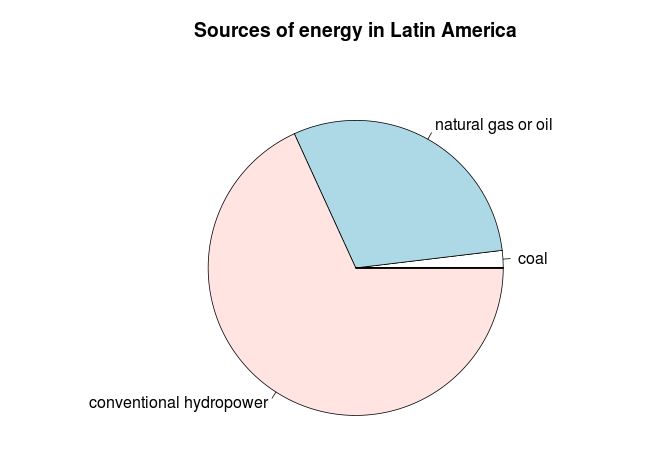
Summary of data: Above is the energy source distribution for both the United States and Latin America, and the percentage each type makes up of the total energy for that region. The amount of energy is measured in megawatts (MW).
The data was found on Duke Energy's website, as part of a 2011 report. Below is a company-issue statement describing their business.
"Duke Energy is one of the largest electric power holding companies in the United States. Our regulated utility operations serve 4 million electric customers in the Carolinas, Indiana, Ohio and Kentucky, and a half-million natural gas customers in Ohio and Kentucky. Our Commercial Power and International Energy business segments own and operate diverse power generation assets in North America and Latin America, including a growing portfolio of renewable energy assets in the United States." (http://sustainabilityreport.duke-energy.com/2011/introduction/company-profile/)
Here is a description taken from their website which explains this report.
"Duke Energy’s 2011 Annual Report and this 2011|2012 Sustainability Report again share a common theme. “Well positioned” is an apt description of our company in 2012, as we start to see real results from the plans we’ve put in place to prepare for the future.
This report describes our progress in bringing advanced energy technologies to market, reducing our environmental footprint, strengthening our position as a best-in-class employer, contributing to the vitality of our communities and growing our business in a responsible way." (http://sustainabilityreport.duke-energy.com/2011/introduction/)
Use the data above to complete the following exercises
1. Create a scatter plot with Latin America megawatts on the x-axis and United States megawatts on the y-axis.
Variables used:
x-axis: latinamericaMW = Latin America megawatts
y-axis: usaMW = United States megawatts
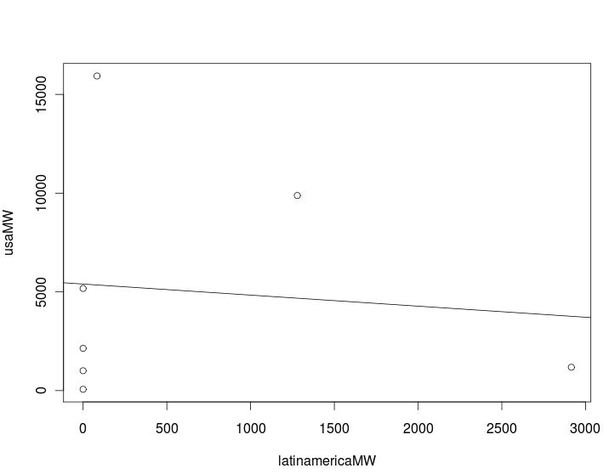
2. Is there a noticeable trend in the data? If not, why?
No, because the megawatt usage of Latin America has no relationship to that of the United States.
3. Create a scatter plot with United States megawatts on the x-axis and Latin America megawatts on the y-axis.
Same variables apply, but on opposite axes.
No, because the megawatt usage of Latin America has no relationship to that of the United States.
3. Create a scatter plot with United States megawatts on the x-axis and Latin America megawatts on the y-axis.
Same variables apply, but on opposite axes.
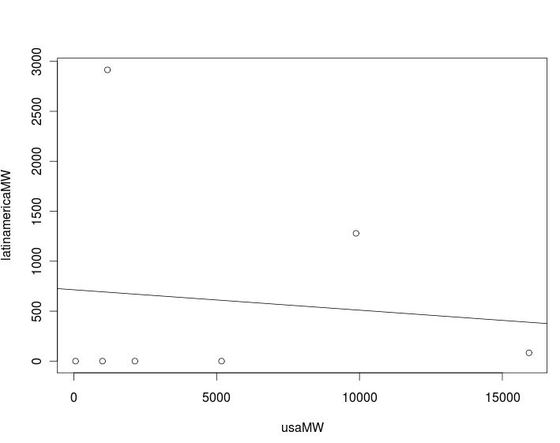
4. Is there a noticeable trend in the data? If not, why?
No, because the megawatt usage of the United States has no relationship to that of Latin America.
5. Create a histogram of United States megawatts.
No, because the megawatt usage of the United States has no relationship to that of Latin America.
5. Create a histogram of United States megawatts.
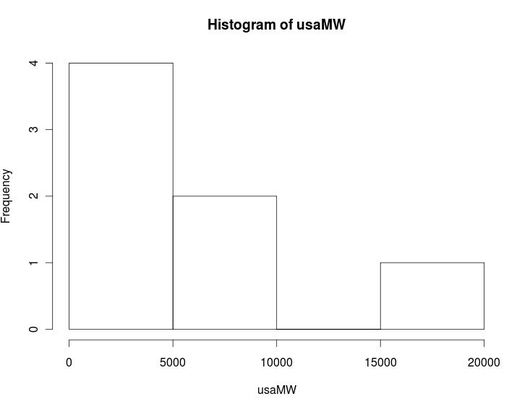
6. Is the data skewed left or right?
The data is skewed to the right.
7. Create a histogram of Latin America megawatts.
The data is skewed to the right.
7. Create a histogram of Latin America megawatts.
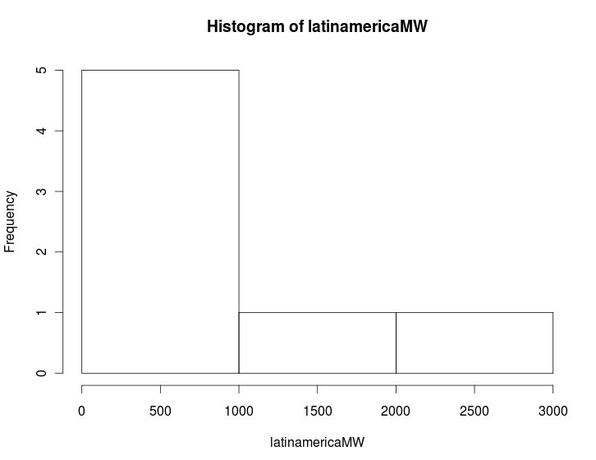
8. Is the data skewed left or right?
The data is skewed right.
9. Create a pie chart using the percentages of each energy source for the United States.
The data is skewed right.
9. Create a pie chart using the percentages of each energy source for the United States.
10. Create a pie chart using the percentages of each energy source for Latin America.
Data Source Citation
"Duke Energy 2011/2012 Sustainability Report." Sustainabilityreport.duke-energy.com. N.p., 2012. Web. 4 May 2014. <Data source: http://sustainabilityreport.duke-energy.com/2011/environmental-footprint/environmental-performance-metrics/>.
Image Citation
"Renewable Energy." Wikipedia. Wikimedia Foundation, 05 May 2014. Web. 06 May 2014. <http://en.wikipedia.org/wiki/Renewable_energy>.
