Starbucks vs. Dunkin Donuts
For our final stats project we decided to examine the nutrition of Starbucks drinks and Dunkin Donuts drinks. From their websites we were able to find the nutrition facts, which we were able to use in order to construct our comparisons. Through R-studio, we were able to construct graphs that further examined the correlation and relationship between various nutritional values, and how they differed between the two stores. Our findings can be found below.
Create a boxplot for the average calories of Starbucks' and Dunkin Donuts' drinks.
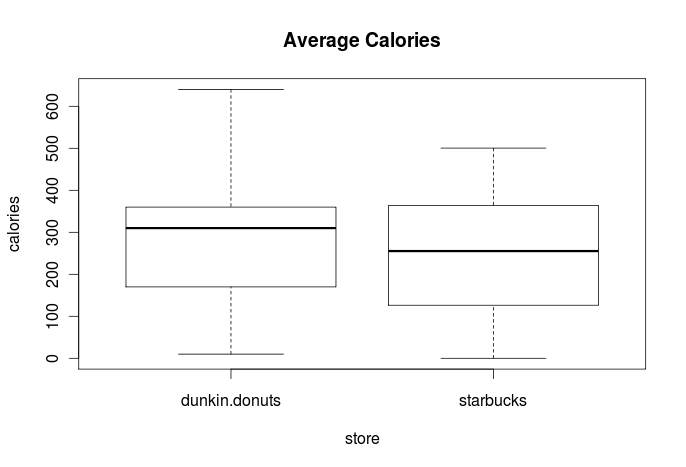
Which store has a larger IQR?
Starbucks
Starbucks
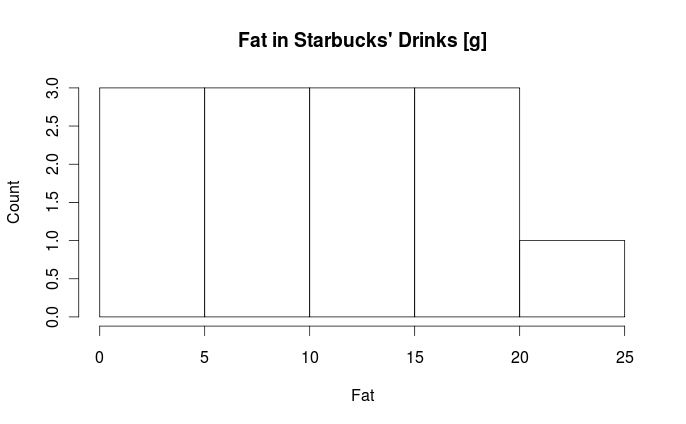
Create a histogram of the fat of Starbucks' drinks.
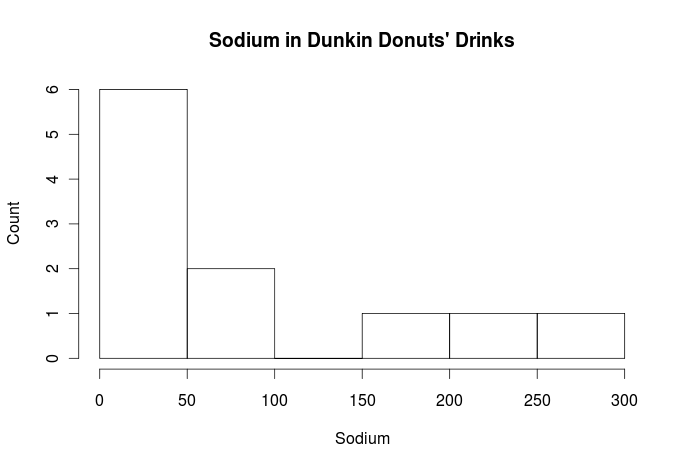
Create a histogram of the sodium in Dunkin Donuts' drinks.
Create a scatter plot for the relationship between carbohydrates and protein. Include the least square regression line.
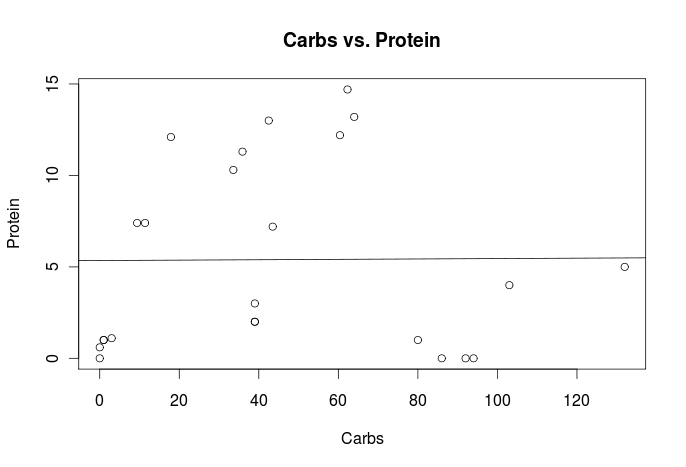
What is the equation of the least square regression line?
y-hat=0.001072x+5.347146
y-hat=0.001072x+5.347146
Is there a correlation between protein and carbohydrates?
There is none.
There is none.
Create a scatter plot for the relationship between sugar and fat. Include the least square regression line
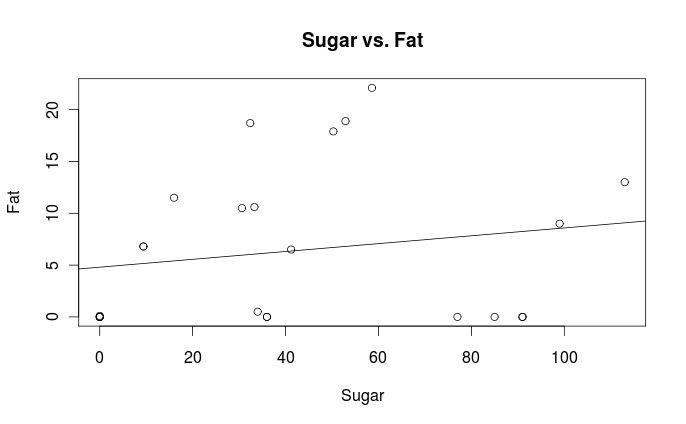
What is the equation for the least square regression line?
y-hat=0.03787+4.79912
y-hat=0.03787+4.79912
What is the correlation?
0.1791482
0.1791482
sources:http://globalassets.starbucks.com/assets/f3caeb51ac53406ea20255e732f98f1d.pdf
http://globalassets.starbucks.com/assets/f3caeb51ac53406ea20255e732f98f1d.pdf
http://globalassets.starbucks.com/assets/f3caeb51ac53406ea20255e732f98f1d.pdf
