NHL Regular Season Statistics
By Terrance Curley, John Tran, and Richard Fu

DESCRIPTION
This data, collected from the official NHL website, contains information about the statistics of all 30 NHL teams during the 2013-2014 regular season. The data set includes wins and losses, as well as things like goals per game, shots per game, and overtime performance. By analyzing this data it is possible to determine the most important stats for success, and see trends in the data sets.
REFERENCE: "2013-2014 - Regular Season - Skater - Summary - Wins," NHL.com. [Online]. Available: http://www.nhl.com/ice/teamstats.htm?season=20132014&game&viewName=summary#. [Accessed: May 7, 2014].
DATA
Import & attach the following data in RStudio to examine the data sets and solve the questions below.
/uploads/1/7/6/7/1767713/nhlstats.csv
gp - "Games Played". (All teams in the NHL regular season played 82 games.
wins - The amount of wins that a team achieved.
losses - The amount of times a team lost.
ot.losses - How many times a team lost in the overtime
points - A team is awarded 2 points for each win, 1 point for losses in overtime or during shootouts, zero points for a loss in regulation time.
row - "Regulation overtime wins"
hrow - "Home regulation overtime wins". The amount of OT wins while playing on home ice.
rrow - "Road regulation overtime wins". The amount of OT wins while playing away.
pp - "Point Percentage". The amount of points a team has devided by the total amount of points that are possible to have (164, or 82*2)
g.pg - "Goals per game". On average.
ga.pg - "Goals against per game". On average.
fvfv.ratio - "Five on five ratio". Used to see the amount of time spent where both teams have all five players out on the ice.
ppp - "Power play percentage". The percentage of time spent where a given team has all five players out, and the opposing team has 1 or more players temporarily taken off the ice because of a penalty.
pkp - "Penalty kill percentage". The percentage of time spent on the opposing end of a power play, because one player is put in the box for a penalty.
s.pg - "Shots per game". The average total amount of shots taken per game, including blocked shots.
sa.pg - "Shots against per game". The average total amount of shots taken per game by the opposing team, including blocked shots.
scfrst.win - "Score first win percentage". The percentage of the time that a given team has won after having scored the first goal.
trfrst.win - "Trailing first win percentage". The percentage of the time that a given team has won after the opposing team has scored the first goal.
ldfrst.win - "Leading after first period win percentage".
ldscnd.win - "Leading after second period win percentage".
os.win - "Outshooting win percentage".
osb.win - "Outshot win percentage".
fo.win - "Face-off win percentage". A face off occurs whenever a puck must be reset. It is dropped between two players who face off for it.
QUESTIONS
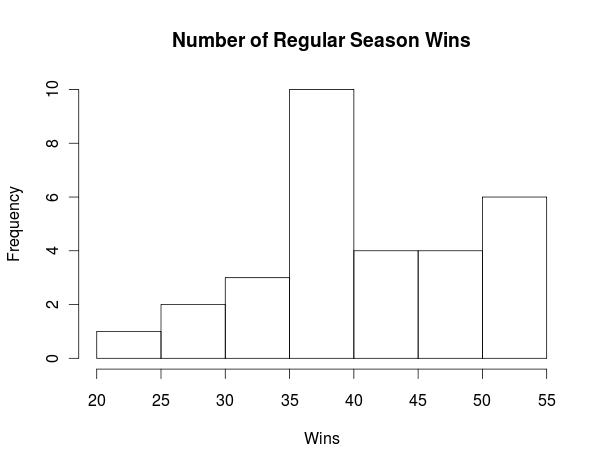
1: Create a histogram of the number of wins. Describe the histogram, is it normal, skewed left, or skewed right?
A: see "graphs". It is skewed slightly to the right.
2: In which range does the mode number of wins fall?
A: 35-40
3: What is the standard deviation?
A: 7.974
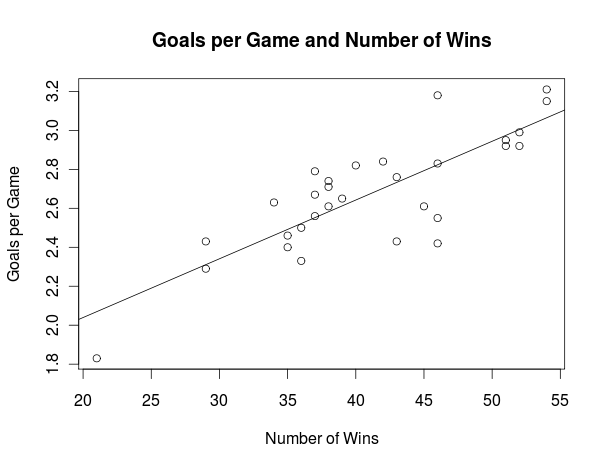
4: Create a scatter plot comparing wins and goals per game, with a line of best fit.
A: see "graphs"
5: What is the correlation between number of wins and goals per game?
A: .816
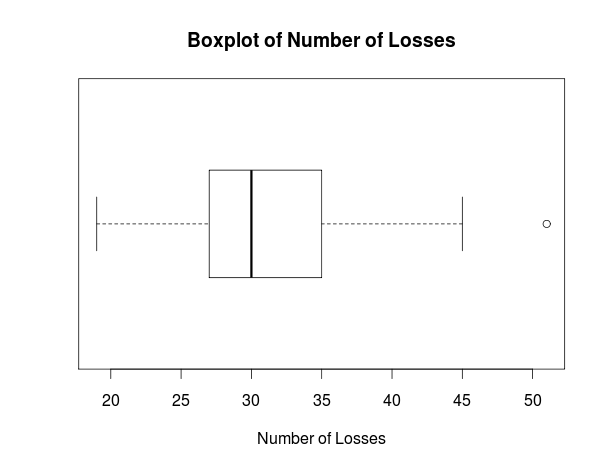
6: Create a boxplot for the data for “losses”.
A: see "graphs"
7: Provide a five-number summary for the data for “losses”.
A: Min. 1st Qu. Median Mean 3rd Qu. Max.
19.00 27.00 30.00 30.77 35.00 51.00
8: What is the IQR for “losses”
A: 8
9: What are the upper and lower outlier thresholds for “losses”?
A: Lower outlier threshold: 15
Upper outlier threshold: 47
There is one outlier (51)
10: How many outliers are there, and what are they?
A: There is one outlier, at 51 losses.
1: Create a histogram of the number of wins. Describe the histogram, is it normal, skewed left, or skewed right?
A: see "graphs". It is skewed slightly to the right.
2: In which range does the mode number of wins fall?
A: 35-40
3: What is the standard deviation?
A: 7.974
4: Create a scatter plot comparing wins and goals per game, with a line of best fit.
A: see "graphs"
5: What is the correlation between number of wins and goals per game?
A: .816
6: Create a boxplot for the data for “losses”.
A: see "graphs"
7: Provide a five-number summary for the data for “losses”.
A: Min. 1st Qu. Median Mean 3rd Qu. Max.
19.00 27.00 30.00 30.77 35.00 51.00
8: What is the IQR for “losses”
A: 8
9: What are the upper and lower outlier thresholds for “losses”?
A: Lower outlier threshold: 15
Upper outlier threshold: 47
There is one outlier (51)
10: How many outliers are there, and what are they?
A: There is one outlier, at 51 losses.
GRAPHS