NFL Statistics in 2012 of 5 players from 4 different positions
By Sebastian D'Amico and Elvis Antigua (sec.4)
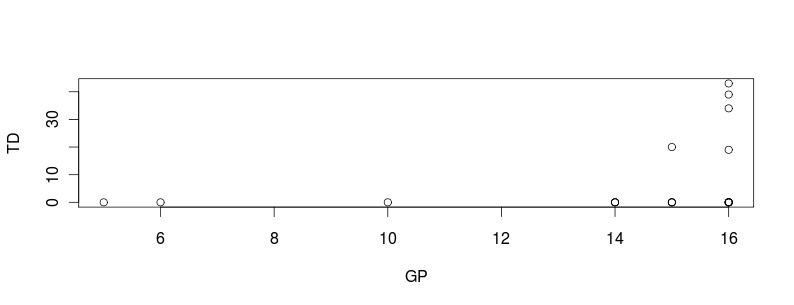
1. find the correlation between games played and passing touchdowns
A: 0.29
A: 0.29
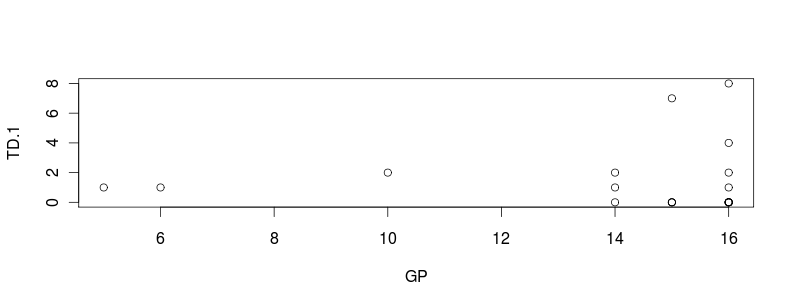
2. find the correlation between games played and rushing touchdowns
0.05
0.05
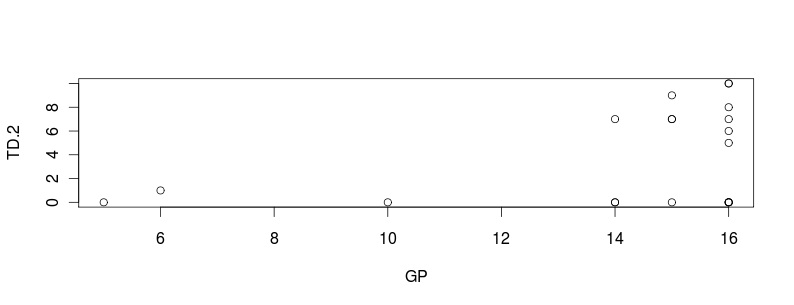
3. find the correlation between games played and touchdown Receptions
A:0.38
A:0.38
For the following questions use the graph Below
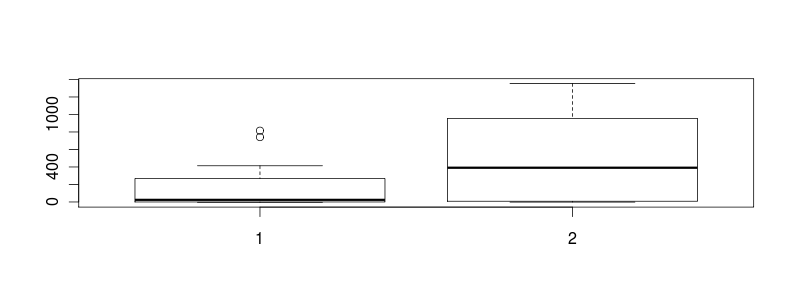
1=Boxplot of Rushing Yards, 2=Boxplot of Recieving Yards
4. Find the Mean of plots 1 and 2
A: Plot 1:175.0, Plot 2: 485.60
5. Find the median of plots 1 and 2
A: Plot 1: 24.5 Plot 2: 391.00
6. Find the Interquartile Range of plots 1 and 2
A: Plot 1: 262.8 plot 2: 932.45 Plot 2:
4. Find the Mean of plots 1 and 2
A: Plot 1:175.0, Plot 2: 485.60
5. Find the median of plots 1 and 2
A: Plot 1: 24.5 Plot 2: 391.00
6. Find the Interquartile Range of plots 1 and 2
A: Plot 1: 262.8 plot 2: 932.45 Plot 2:
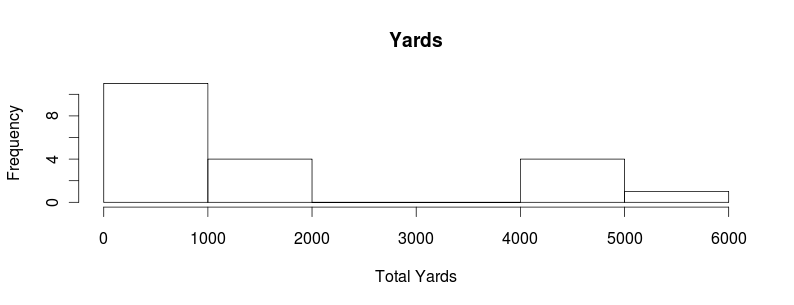
7. Refer to the graph below. What is the probability of a player having between 1000-2000 yards? 482?
A: 0.25
A: 0.25
Refer to the graph below for the following questions
8. Does the following graph show a strong or weak correlation?
A: Weak
9. Does the following graph show a positive or negative direction
A: Positive
8. Does the following graph show a strong or weak correlation?
A: Weak
9. Does the following graph show a positive or negative direction
A: Positive
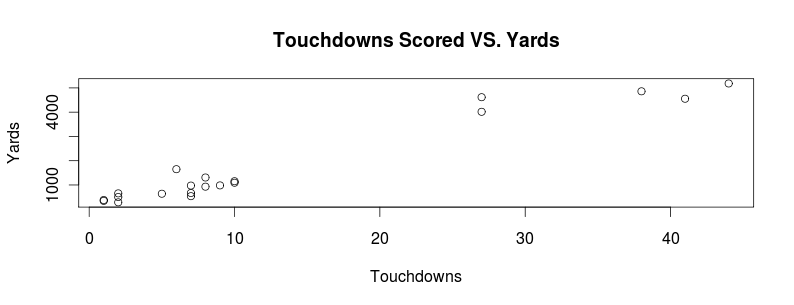
10. In the scatterplot above are there any outliers? If so, what affect do they have on the data?
A: Yes. there are the outliers. The affect they have on the data is that the outleirs skew the data.
A: Yes. there are the outliers. The affect they have on the data is that the outleirs skew the data.
