Determining How Location Affects Wealth, Education, Politics, and Health
By: Kaitlyn Morris, Hannah Greeley, and Mackenzie Lane
Overview
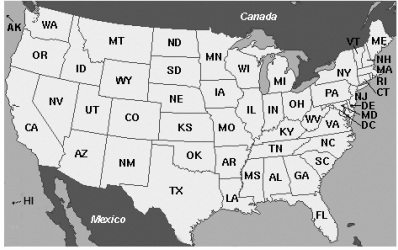
This study investigated the affects that location in the United States had on three factors: wealth, education, and health. The data has been collected from each of the 50 states in the United States. Through looking at the data, it is evident that depending on what state one resides in, impacts their SAT scores, their likeliness to be obese, and their income.
Questions To Answer
Does which state you choose to live in impact the likeliness of receiving a better education?
Does which state you choose to live in impact your likeliness of becoming obese?
Does which state you choose to live in impact your average income?
References
"Adult Obesity Facts." Centers for Disease Control and Prevention. Centers for Disease Control and Prevention, 28 Mar. 2014. Web. 28 Apr. 2014.
"Alabama QuickFacts from the US Census Bureau." Alabama QuickFacts from the US Census Bureau. N.p., n.d. Web. 30 Apr. 2014.
"College Board." Average SAT Scores. N.p., n.d. Web. 07 May 2014.
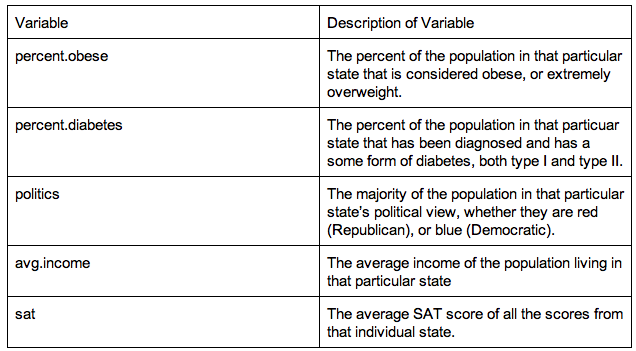
Description of Variables
Exercises
1.) Create a scatter plot of the data for average income and obesity.
2.) Looking at the scatter plot above, is there any correlation between the average income and obesity rates in each state?
3.) Create a box plot of the data comparing which political views that state holds with the average sat score.
4.) Using the box plot above, what is the correlation between the two variables?
5.) Create a scatter plot of the states' percent of obesity vs. its percent of diabetes
6.) Is there a positive, negative, or no correlation between the average percent of obesity in each state and the average percent of diabetes?
7.) Create a scatter plot of the average SAT scores for each state compared with the average income.
8.) Does there appear to be a correlation between the two variables?
9.) Create a scatter plot for the states' average income and average SAT Score
10.) After looking at the scatter plot from above, is there any correlation between the two variables?
Exercise Responses :
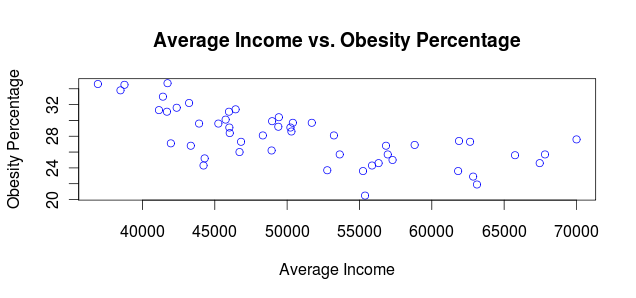
After looking at the scatter plot above, there does seem to be a correlation between the average income and obesity rates in each state. It appears that as the larger the average income gets, the smaller the average obesity percent gets.
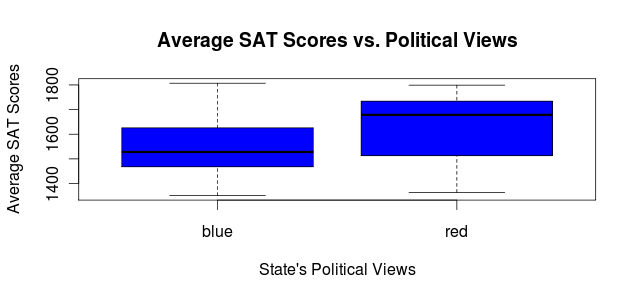
The correlation between the two variables from the scatter plot above shows that if you have a higher SAT Score average, you most likely live in a state that is red, or Republican.
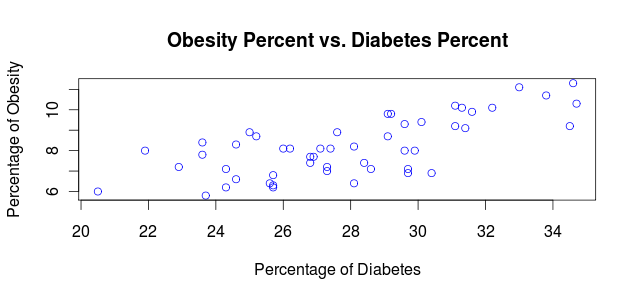
There is definitely a positive correlation between the percentage of obese people in each state and the percentage of people with diabetes in that same state. It is evident that the larger the amount of people who are obese gets, so does the amount of people diagnosed with diabetes.
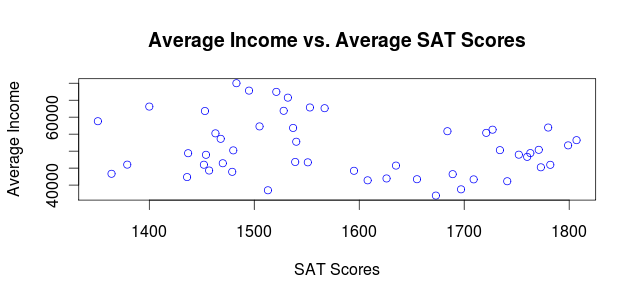
There really does not appear to be any correlation, positive or negative, between a states' average income and its average SAT score.
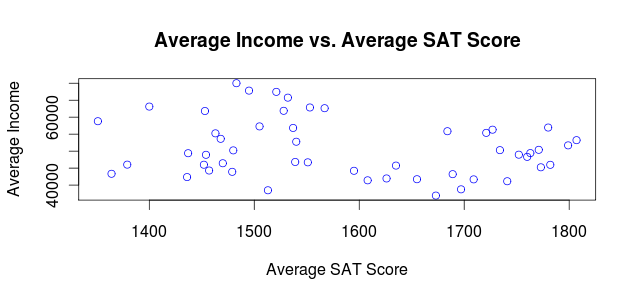
There does not seem to be a correlation between average income and average SAT Score.
