Decline in SAT Scores Over the Past 10 Years
Data Source: https://nces.ed.gov/fastfacts/display.asp?id=171
Exercises
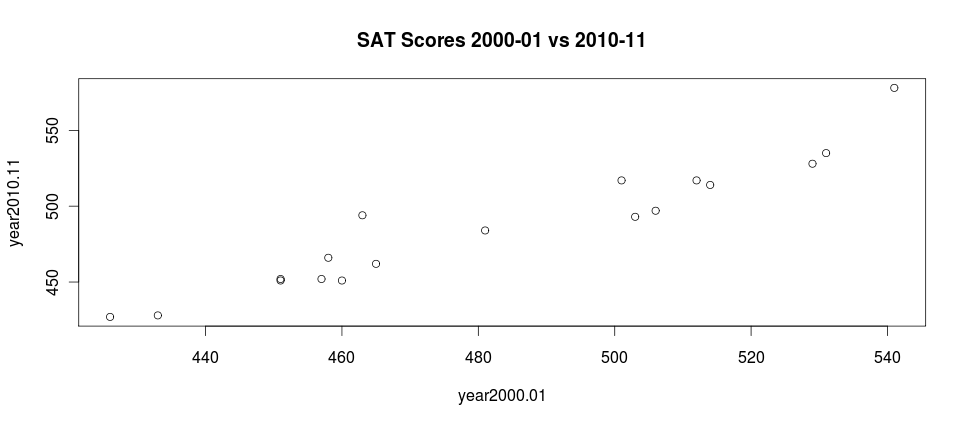
1. Construct a scatter plot of SAT scores in 2000-2001 compared to 2010-2011.
1. Construct a scatter plot of SAT scores in 2000-2001 compared to 2010-2011.
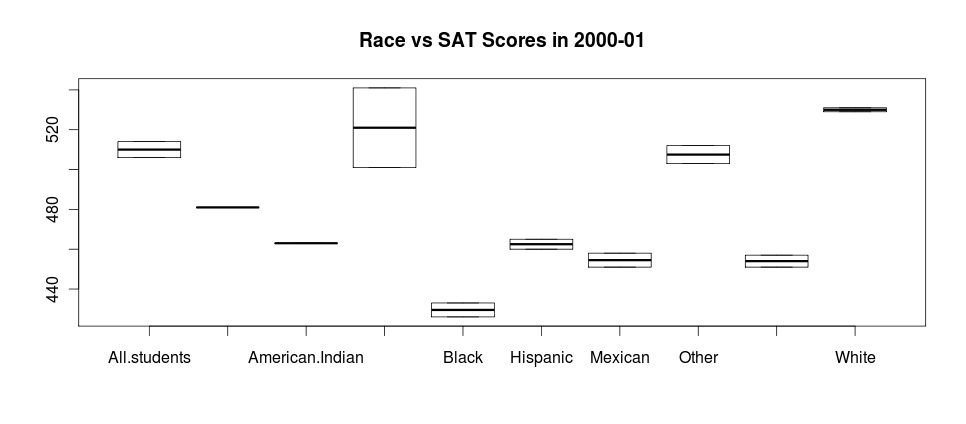
2. Construct a box pot of race compared to SAT scores in 2000 to 2001.
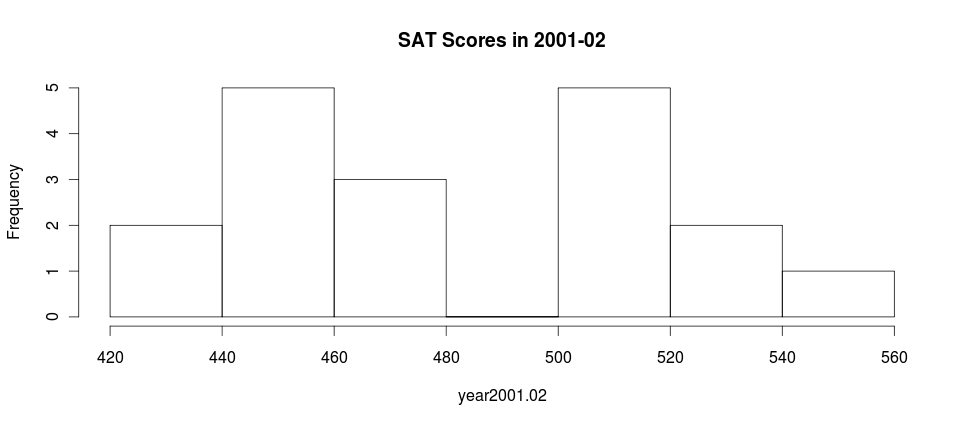
3. Construct a histogram of SAT scores in 2000-2002.
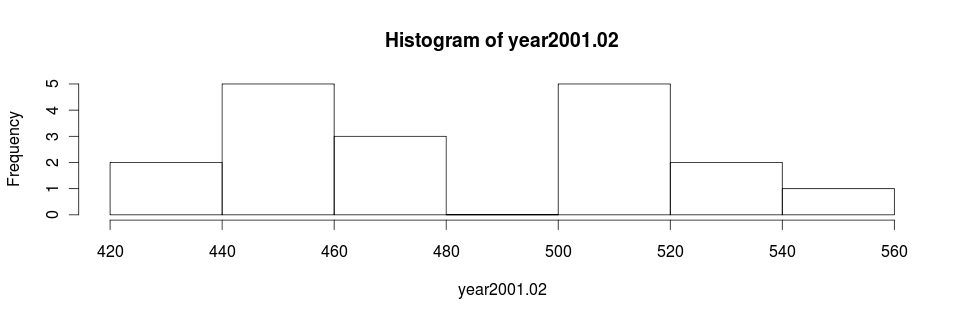
4. Construct a histogram of SAT scores in 2000-2002.
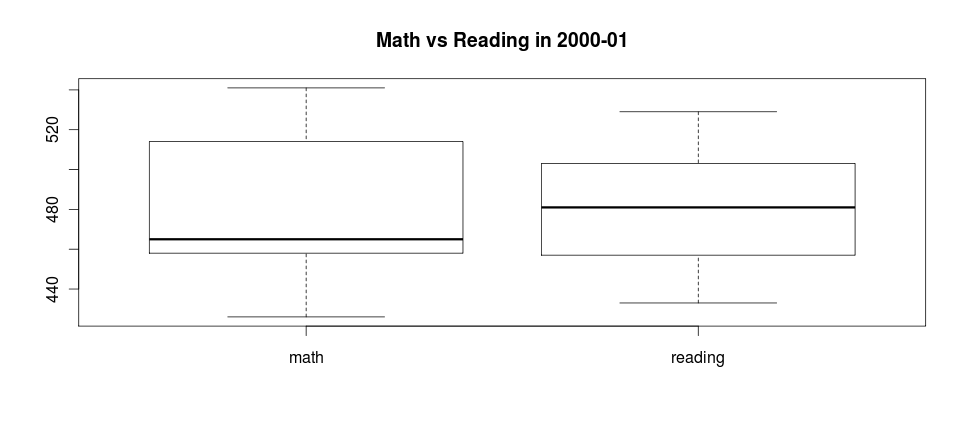
5. Construct a box plot of Math vs. Reading scores in 2000-2001.
6. Calculate the minimum score, Q1, median score, mean score, Q3, and maximum score in 2001-2002.
Summary of Year 2001-02
Min. 1st Qu. Median Mean 3rd Qu. 427.0 455.5 473.5 482.2 511.5 Max. 548.0
Min. 1st Qu. Median Mean 3rd Qu. 427.0 455.5 473.5 482.2 511.5 Max. 548.0
7. Construct a stem and leaf plot of the scores in 2001-2002.
Stem and Leaf Plot of Year 2001-02
4 | 33
4 | 55666678
5 | 0001233
5 | 5
4 | 33
4 | 55666678
5 | 0001233
5 | 5
8. Calculate the mean score in 2001-2002.
mean(year2001.02)
482.2222
482.2222
9. Calculate the minimum score, Q1, median score, mean score, Q3, and maximum score in 2011-2012.
Summary of Year 2011-12
Min. 1st Qu. Median Mean 3rd Qu. 428.0 452.0 486.5 485.2 515.5 Max. 581.0
Min. 1st Qu. Median Mean 3rd Qu. 428.0 452.0 486.5 485.2 515.5 Max. 581.0
10. Construct a stem and lead plot of the scores in 2011-2012.
Stem and Leaf of Year 2011-12
4 | 33
4 | 555567899
5 | 012234
5 | 8
4 | 33
4 | 555567899
5 | 012234
5 | 8
11. Calculate the mean score in 2011-2012.
mean(year2011.12)
485.1667
485.1667
