Pizza Showdown: Domino's vs. Pizza Hut Nutrition
by: Ariadne Argyros Section 03
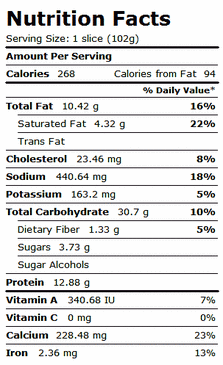
Many of us, myself included, love to sit down on Friday nights and eat our favorite pizzas as a family while watching television. This got me thinking about how much we are eating when we don't think about it. In this case study, I procured data from Pizza Hut and Domino's about 10 different types of pizzas with the calories per slice, total fat (g), saturated fat (g), cholesterol (mg), and carbohydrates (g). Now we can all see for ourselves how much we really eat (SPOILER ALERT:it is really depressing and shockingly horrifying).
1. What is the mean number of calories in Dominos pizza? In Pizza Hut?
Answer: Dom: 2707.6
PH: 2336.8
2. Which of the following graphs displays the correct stem-and-leaf plot for the total fat (g) in Pizza Hut pizza?
a)
1 | 0444
1 | 559
2 | 00
2 | 8
b)
0 | 0
0 | 55566777
1 | 0
c)
0 | 111111223
0 |
1 |
1 |
2 | 0
d)
0 | 04
0 | 5566679
1 |
1 |
2 | 2
Answer: a
3. Calculate the median, Q1, Q3, and the IQR of the data set.
Answer: median= 15
Q1= 14
Q3= 20
IQR= 6
4. Create a boxplot for the amount of carbohydrates (g) in Domino’s pizza.
Answer:
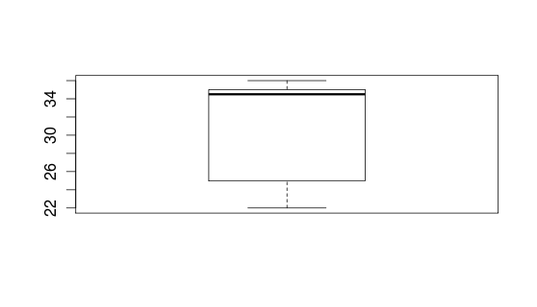
5. This distribution is
a) skewed right
b) symmetric
c) skewed left
d) unable to tell
Answer: c
6. Create a histogram for the amount of cholesterol (mg) in Pizza Hut’s pizza.
Answer:
a) skewed right
b) symmetric
c) skewed left
d) unable to tell
Answer: c
6. Create a histogram for the amount of cholesterol (mg) in Pizza Hut’s pizza.
Answer:
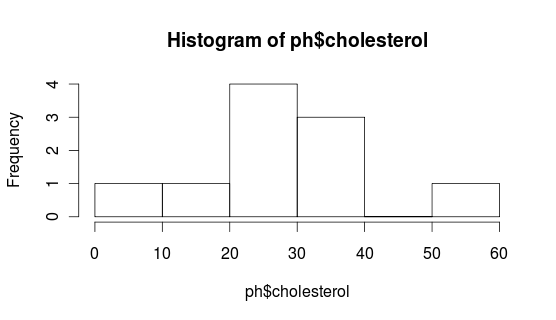
7. The median of the cholesterol data above is
a) 27.5
b) 31
c) 29.5
d) 30
Answer: d
8. Find the standard deviation and variance for the dataset in question 2.
Answer: sd= 5
var= 25
9. Look back and reference question 2 again. If two more pizzas with 15 g of total fat in Pizza Hut pizza were added
a) both the mean and variance would stay the same
b) the mean would increase but the variance would stay the same
c) both the mean and variance would decrease
d) the mean would decrease but the variance would increase
Answer: c
10. Someone claims to have tested their Pizza Hut slice and found it to have 32 g of total fat. Based on the above data is this accurate?
Answer: 32 g is 3.2 standard deviations away from the mean, and 99.7% covers only up to 3 standard deviations
from the mean (which would be 31 g). 32 g is not within 3 standard deviations and so therefore is not accurate.
Pizza Hut Nutrition Info:
http://www.nutrition-charts.com/pizza-hut-nutrition-information/
Domino’s Nutrition Info:
http://cache.dominos.com/homev8/docs/menu/dominos_nutrition_v2.21.00.pdf