TOM BRADY AND PEYTON MANNING FOOTBALL STATISTICS
ROY BAHNAM
DINAH JEAN PHILIPPE
DINAH JEAN PHILIPPE
Download Data
Tom Brady
Year Comp.Perc Yards Pass.TDs Rush.TDs
2003 60.2 3620 23 1
2004 60.8 3692 28 0
2005 63 4110 26 1
2006 61.8 3529 24 0
2007 68.9 4806 50 2
2009 65.7 4398 28 1
2010 65.9 3900 36 1
2011 65.6 5235 39 3
2012 63 4827 34 4
2013 60.5 4343 25 0
Peyton Manning
2003 60.7 4267 29 0
2004 67.6 4557 49 0
2005 67.3 3747 28 0
2006 65 4397 31 4
2007 65.4 4040 31 3
2008 66.8 4002 27 1
2009 68.8 4500 33 0
2010 66.3 4700 33 0
2012 68.6 4659 37 0
2013 68.3 5477 55 1
QUESTIONS
1. Construct a scatter plot of both Tom Brady and Peyton Manning’s yards according to year. Include a key.
2. Construct a plot of rushing touchdowns vs. passing touchdowns. Include the linear regression line.
3. What is the equation for the linear regression line?
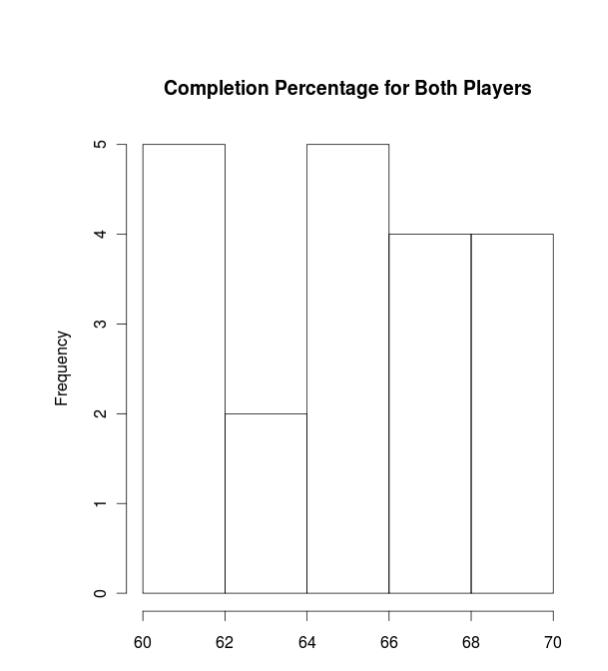
4. Create a histogram of the completion percentage.
5. What’s the mean passing touchdowns and mean yards for both players?
6. Create a boxplot of passing touchdowns for both players.
7. Are there any outliers? If so, how can you tell and what are they?
8. Calculate Q1 and Q3 of the passing touchdowns boxplot?
9. What is the IQR?
10. What is the median passing touchdowns of both players according to the boxplot?
ANSWERS
1.
1. Construct a scatter plot of both Tom Brady and Peyton Manning’s yards according to year. Include a key.
2. Construct a plot of rushing touchdowns vs. passing touchdowns. Include the linear regression line.
3. What is the equation for the linear regression line?
4. Create a histogram of the completion percentage.
5. What’s the mean passing touchdowns and mean yards for both players?
6. Create a boxplot of passing touchdowns for both players.
7. Are there any outliers? If so, how can you tell and what are they?
8. Calculate Q1 and Q3 of the passing touchdowns boxplot?
9. What is the IQR?
10. What is the median passing touchdowns of both players according to the boxplot?
ANSWERS
1.
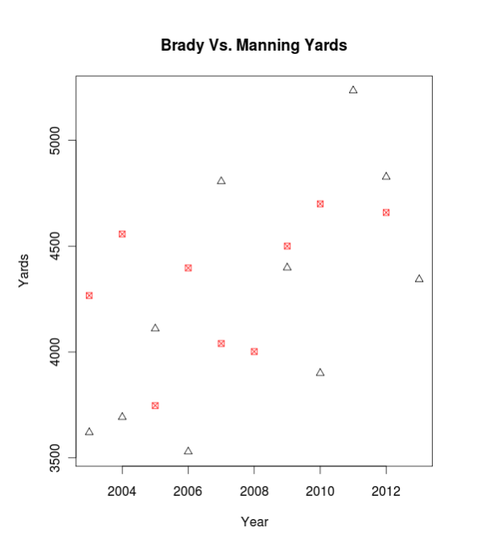
KEY:
Tom Brady= triangles
Peyton Manning= x-squares
2.
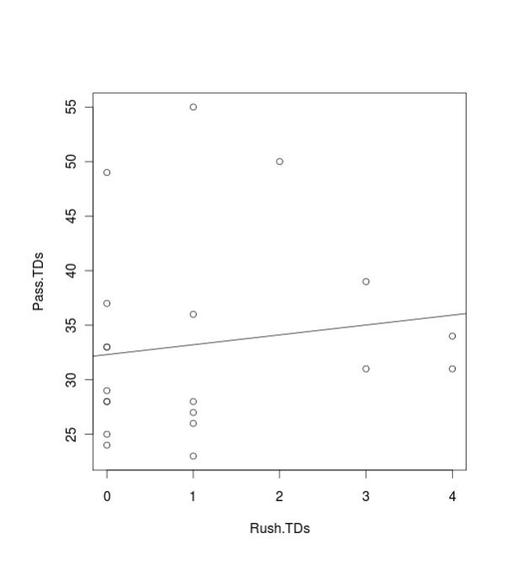
3. y= 0.905x + 32.304
4.
4.
5. Passing Tds: 33.3
Yards: 4340.3
6.
Yards: 4340.3
6.
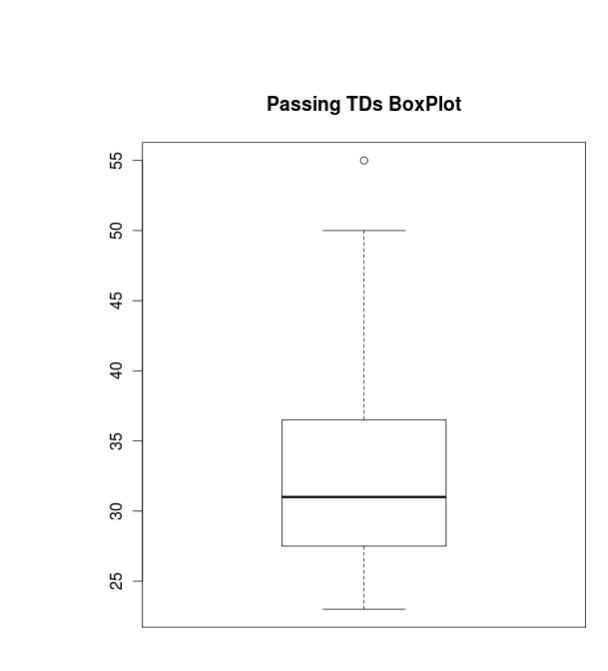
7. Yes, the outlier appears outside of the boxplot and exceeds Q3. The outlier is 55.
8. Q1= 27.75
Q3= 36.25
9. IQR = 36.25 - 27.75 → IQR = 8.5
10. Median = 31
8. Q1= 27.75
Q3= 36.25
9. IQR = 36.25 - 27.75 → IQR = 8.5
10. Median = 31
REFERENCES
http://www.nfl.com/player/tombrady/2504211/careerstats
http://www.nfl.com/player/peytonmanning/2501863/careerstats
http://bleacherreport.com/articles/1929238-peyton-manning-vs-tom-brady-rivalry-analyzing-qbs-from-afc-championship-2014
http://www.nfl.com/player/tombrady/2504211/careerstats
http://www.nfl.com/player/peytonmanning/2501863/careerstats
http://bleacherreport.com/articles/1929238-peyton-manning-vs-tom-brady-rivalry-analyzing-qbs-from-afc-championship-2014
